Case study CS-11 · automotive e-drive and battery-module assembly · industry archetype
A battery-module line in a DACH plant is nine weeks past start of production. Five automated stations, an end-of-line test bench, three shifts, a new module generation, and an OEM launch team that reviews units per shift every Thursday. This launch book follows one module serial through the line and shows what the plant can read, record and decide when every station and the test bench report into one record, and what that is worth in the plant's own quantities: first-pass yield at the bench, weeks from SOP to rate, seconds against takt, minutes per genealogy lookup, serials inside a containment scope.
This is an industry archetype, not a customer. The plant, the line and every figure are modelled from how such lines run; the inputs sit on sheet 7 where a reader can replace them with their own. Pragmatos reads the line; it writes nothing to a station, a bench or a controller.
| Plant Manager | units per shift against the ramp-up plan, OEE per line and shift, for the Thursday launch review with the OEM. |
| Head of Quality | first-pass yield at the bench, ppm at the customer, open findings, for the IATF 16949 surveillance audit and the OEM's VDA 6.3 process audit. |
| Ramp-up lead | weeks from SOP to rate, station cycle time against takt, and the day a field finding arrives and the containment scope has to be named in serials within the 24 hours the 8D's D3 step allows. |
What the module is
Cells arrive in supplier lots. At 010 the carrier gets its serial as a data-matrix code and the cell-lot IDs are married to it. 020 presses the contacts, 030 dispenses the thermal adhesive, 040 welds cells to the copper busbar, 050 tests insulation, open-circuit voltage, contact resistance and leak. Packs downstream take the module serial into their own record.
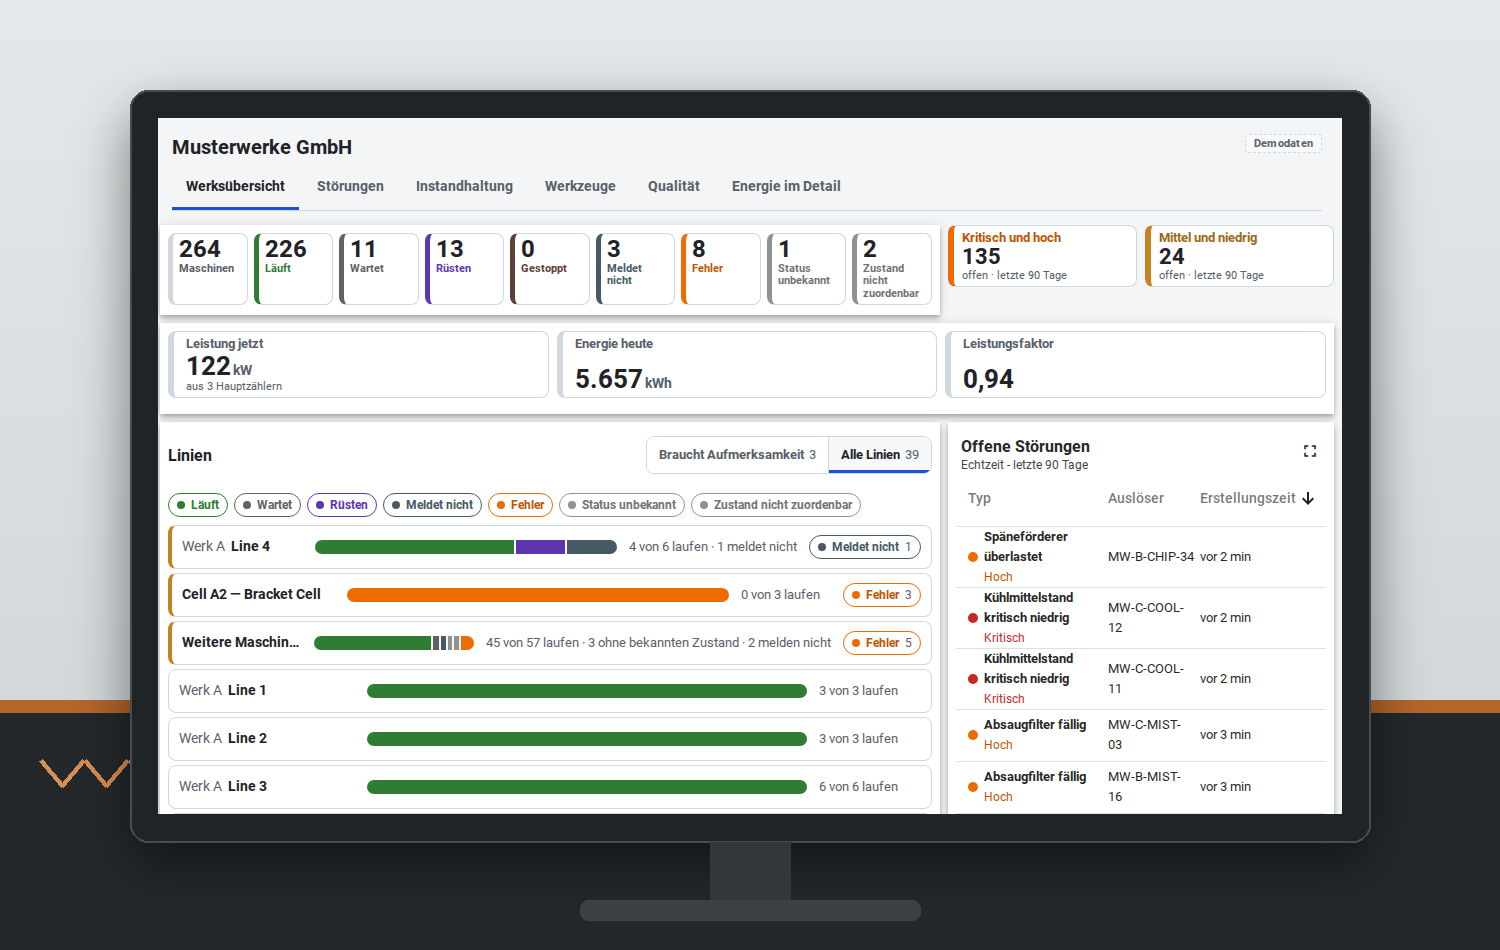
Pragmatos Live on the launch-office monitor: machine states across the plant, power and energy today, every line with how many of its machines run, open faults by age. The demo plant on the screen is the product's own sample data, shown as recorded at 1×.
The walk follows the module in build order. For each station: what it measures, what Pragmatos reads from it, and which part of the platform does the work. Every read is one-directional: Loom, the connection software on the plant's own server, polls or receives; it never writes a parameter, a setpoint or a result back. A supervisor approves each connection before it carries data, and a station that misses three polls is shown as stale rather than assumed fine.
The station scans the carrier's data-matrix code, scans the cell-lot labels of the cells loaded, and records torque and angle for each screw position. Loom reads the station's cell controller over OPC UA and takes the lot-marriage record as the station's CSV export. Pragmatos Live opens the part history for this serial: the record every later station reports into, kept for the life of the part plus one year.
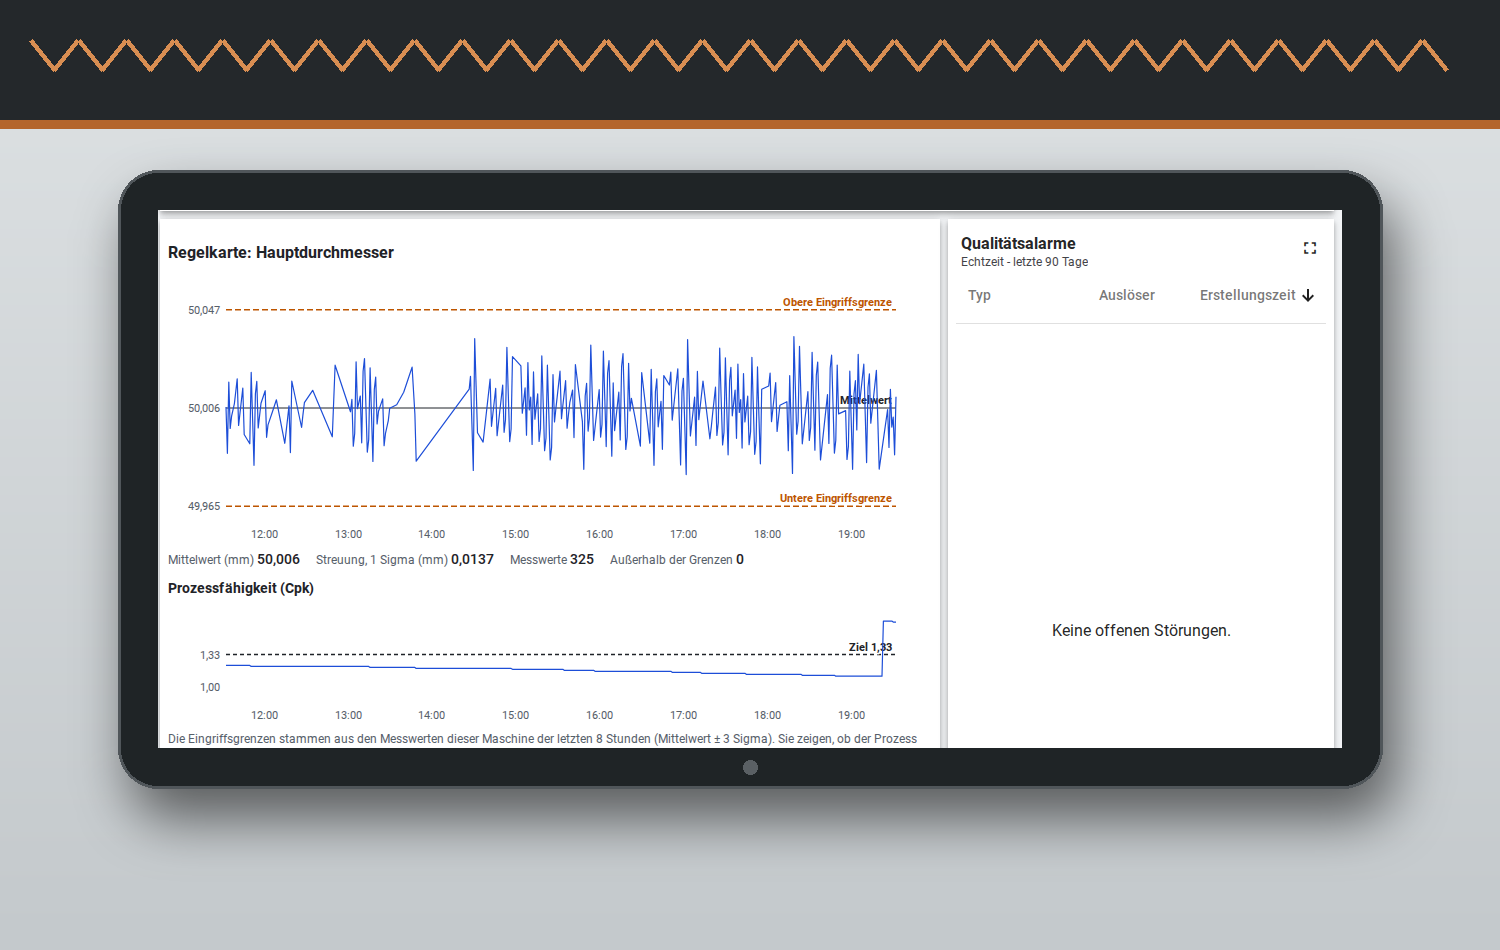
READ PATH · OPC UA (read) · CSV export · store-and-forward if the network dropsPeak force and press-in depth per contact are the characteristics the OEM's control plan names. Pulse keeps a control chart per characteristic with run rules (AIAG/VDA 7-point, Western Electric 8, Nelson 9) and shows Cpk against the plan's limit (1,33 running, 1,67 at PPAP). A characteristic that trips a rule is flagged "process not stable" on the chart; the station is not touched.
READ PATH · S7 (read) from the press controller · one sample per contactDispensed mass per module and the adhesive lot in the dispenser go into the part history, so the genealogy later answers "which modules carry adhesive lot X". Orbis watches the bead-weight series and raises a drift card when the trend leaves the band; the card says what it saw and how much of the series it saw (the confidence value is a data-coverage figure, not a defect probability).
READ PATH · Modbus TCP (read) from the dispense controller · adhesive lot by barcode scanThe welding cell reports OK/NOK per joint from its own seam monitor and the cycle time per module. Pragmatos Live shows OEE per station and shift (ISO 22400-2) and the station-to-takt comparison on the line screen: 040 is the one that runs at 104 s against a 100 s takt. The ramp-up lead sees the loss in seconds per module, per shift, before the Thursday review.
READ PATH · OPC UA (read) from the cell PLC · cycle-time stamps per serialThe bench writes a result file per serial: four test steps, pass/fail, measured values, an NOK code. Loom takes the file over the bench's REST export; first-pass yield per shift and per NOK code appears in Pragmatos Live. When Orbis finds an out-of-control pattern across serials, Decisions puts a proposed containment scope in the quality engineer's queue (a list of serials, nothing more), and Flow carries the hold, the rework order and the release once two signatures are on it.
READ PATH · REST export from the bench PC · CSV fallback · results per serialWhere the software runs
On premise, in the plant's own cloud tenancy, or both. Loom is software (a service on the plant server or a VM near the line), not hardware on the line. No station parameter changes because Pragmatos is present.
Who approves what
Every connection: a supervisor. Every hold: one named role. Every release: two signatures. Approval is never granted by elapsed time; a proposal that nobody answers stays a proposal.
What the record keeps
Cell lots, adhesive lot, every station result, bench values, who held and who released, with timestamps: the per-serial record an IATF 16949 auditor asks to see, and the one the 8D's D3 step needs within 24 hours.
Ramp-up curve · units per shift · weeks from SOP
Both curves are the model's inputs (sheet 7). The plan line is the OEM's 26-week ramp as the plant has it; the modelled line is the same shape four weeks shorter, which is what sheet 5 asks the line to do. The hatched area is counted once, at the module margin of C-12.

The same machine record, three tabs: the control chart with its run rules is Pulse, the containment proposal under it is Decisions, the hold-rework-release queue is Flow. A quality engineer reads all three at the station on one screen. Demonstration plant.
What the five records have in common
Each is a record fail: the measurement exists at the station or the bench, but not against the serial, not in one place, not within the plan's time. The platform holds the record, shows it where the three buyers already look, and puts proposals, never actions, in front of the person who decides.
What a field finding looks like on this record
A cell-lot number arrives from the OEM's warranty desk at 09:10. The quality engineer opens the lot in Pragmatos Live: the genealogy returns every module serial built with it, the station results each one has, and the pack serials they went into: one screen, under five minutes, instead of 45 minutes per serial across three systems. The scope is 120 serials from two shifts, not the month's 2,400.
The three words
| Sperren | one named role sets the hold on the 120 serials; Flow opens a quality lot hold (held / inspect / rework / scrap) and the work orders that follow it. |
| Nachmessen | re-measurement at 050 for the held serials; the bench values land against each serial in the same record. |
| Freigeben | two signatures release; nothing releases on elapsed time. The release, who signed and when, stays in the part history for the life of the part plus one year. |
D3 of the 8D (containment scope, affected serials, where they are) is a print of this screen, inside the 24 hours the OEM allows. Record completeness on the line screen shows what share of serials carry a complete record; a serial with a missing station result is visible as such, not assumed complete.

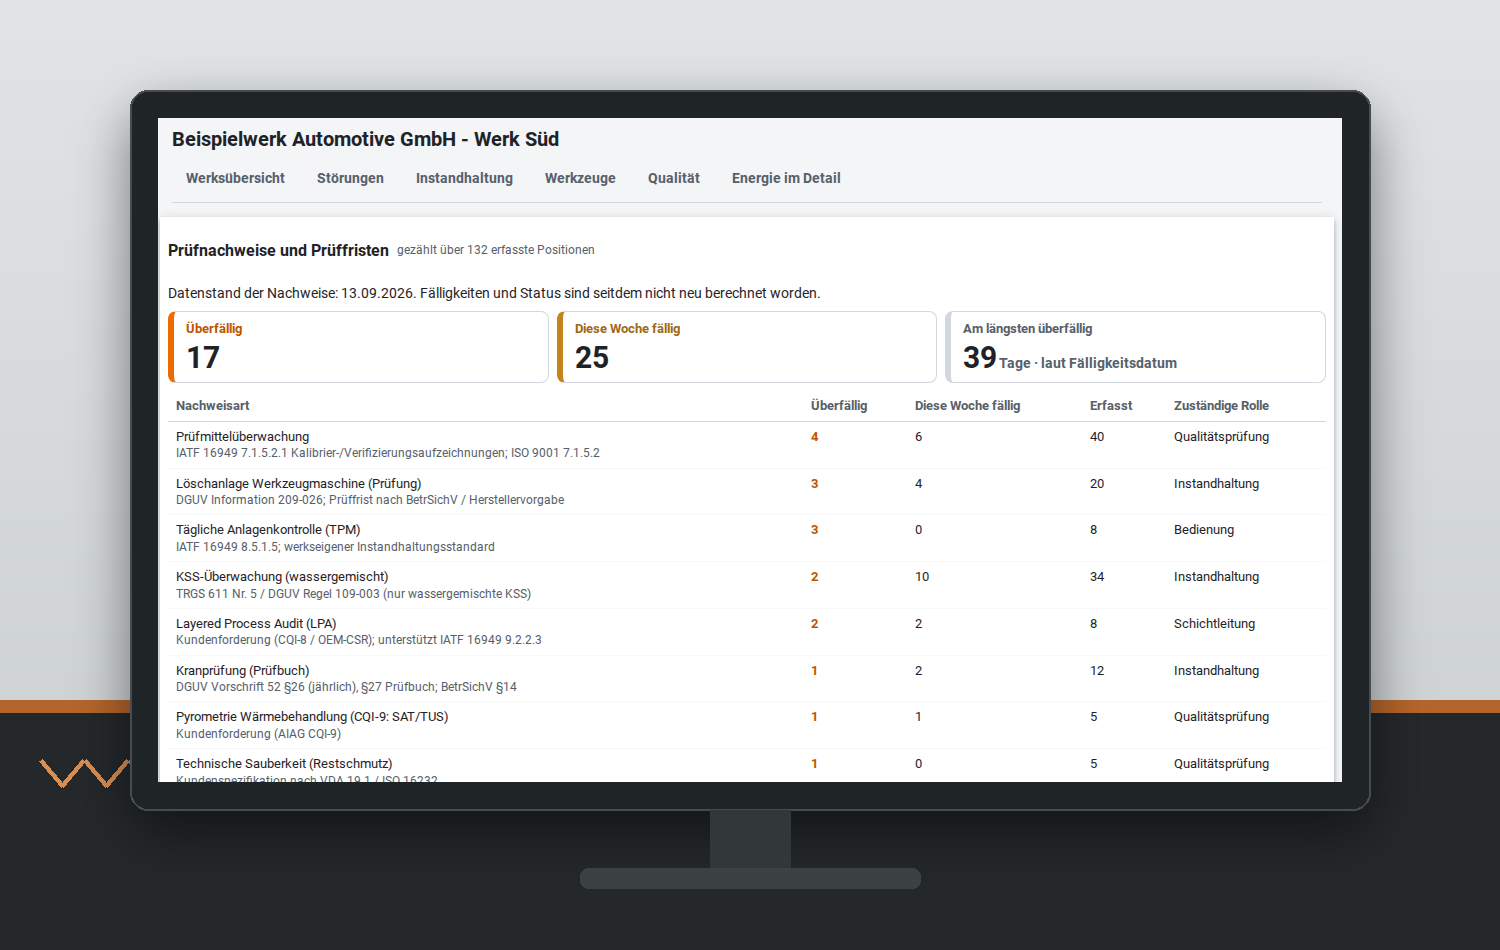
Quality office, OEM audit week. The records screen lists each proof type the plant has to show (IATF 16949 internal audits, layered process audits, VDA 19.1 cleanliness, CQI-9 heat treatment, DGUV inspections), with its interval, the responsible role, what is overdue and what falls due this week. The plant on the screen is the product's own sample data, shown as recorded at 1×. The platform keeps the records an audit asks for; a competent person performs the inspection and the auditor forms the judgement.
Containment scope · serials per event
Today the scope is "all modules of that month": 600 serials. With cell lot → module serial in one record it is the modules that carry the named lot: 120. C-20, C-21 · R-05 · MODELLED
Genealogy lookup · minutes per serial
Today three systems and a spreadsheet join; modelled, the part history on one screen in Pragmatos Live. 300 lookups a year at the quality engineer's loaded rate. C-16, C-17, C-18 · R-04 · MODELLED
Audit preparation · hours per audit
Today four exports joined by hand; modelled, the records screen and the part history printed per sample. Four audits a year: OEM process audit, IATF surveillance, two customer visits. C-19 · R-04 · MODELLED
The staircase runs inside the OEM's 26-week ramp plan. No tread changes a station; each one adds a read, a record or a decision path, and each is approved by the plant's own people before the line leans on it. The modelled rate week is 22 (C-10); the plan's is 26 (C-09).
Who signs each tread
L1: the automation supervisor, per connection. L2: the launch lead, when the record is complete for a full shift. L3: the quality engineer, per characteristic. L4: the head of quality, for the hold and release roles. L5: the plant manager, for the ERP hand-over.
What stays with the plant
Controllers, bench software, parameters, the control plan, the people who act. On premise, in the plant's own cloud tenancy, or both; the record is kept for the life of the part plus one year, up to 15 years for this product class.
What is not on the staircase
No setpoint, no station parameter, no bench limit is ever written by the platform. The battery-passport document for 2027 is not a tread: the per-serial data it needs is, the document itself is on the product outlook.
What the Thursday launch review reads at each tread
| Tread | Number on the screen | Who reads it | Module |
|---|---|---|---|
| L1 · Read | Five connections, each live or stale; last poll per station | Automation supervisor | Loom |
| L2 · Record | Record completeness per shift: share of serials with every station result present | Launch lead | Pragmatos Live |
| L3 · Chart | Cpk per control-plan characteristic; run-rule flags per shift; drift cards with coverage | Quality engineer | Pulse · Orbis |
| L4 · Decide | Open proposals; serials under hold; hours from proposal to two signatures | Head of Quality | Decisions |
| L5 · Hand over | Units per shift against the ramp plan; OEE per station against takt; 8D steps open | Plant Manager | Pragmatos Live · Flow |
How to read the board
Each pair is scaled to its own unit, so bar heights compare today with modelled inside a pair, never across pairs. The € figures do compare: R-01 and R-02 carry two thirds of the total; R-04 is the smallest and the surest, because it is hours of a named person. R-06 is the field exposure per event multiplied by a quarter of an event a year (C-24): the one figure on this sheet that the plant manager would set higher or lower from the plant's own warranty history.
Shown, not counted
Warranty cost per vehicle, OEM audit findings and their follow-up, the battery-passport data set, and a second line on the same records. Each would add to the total; none is in it. The scrap-per-point figure of the cell-production study (S1) is not applied to module assembly.
What moves each bar, and who moves it
| Result | Lever (the input that changes) | Who moves it | Where it shows |
|---|---|---|---|
| R-01 | First-pass yield at the bench, 85 → 87 % (C-04, C-05): the NOK code lands against the serial and the station, so the recurring cause is visible per shift | Quality engineer, station owners | Pragmatos Live FPY card · Pulse per characteristic |
| R-02 | Weeks from SOP to rate, 26 → 22 (C-09, C-10): the Thursday number is read from the record, not argued from a spreadsheet. The weakest figure on the board | Launch lead | Live line screen · units per shift against plan |
| R-03 | Station 040 cycle, 104 → 100 s (C-14): the station-to-takt comparison names the loss per module, per shift | Ramp-up lead, cell owner | Live OEE per station (ISO 22400-2) |
| R-04 | Lookup 45 → 5 min, audit preparation 24 → 8 h (C-17, C-19): the part history replaces the join of three systems | Quality engineer | Live part history · records screen |
| R-05 | Containment scope 600 → 120 serials (C-20, C-21): cell lot → module serial on one record | Head of Quality holds, two signatures release | Decisions proposal · Flow quality lot |
| R-06 | Field exposure per event, €1,5 m → €0,3 m (C-25 × scope): the same scope reduction priced at the field rate; the plant sets C-24 and C-25 from its own warranty history | Plant Manager, warranty desk | Calculation sheet 7, not a screen |
Inputs ASSUMED: archetype values, replace with the line's own
| ID | Input | Value |
|---|---|---|
| C-01 | Planned rate, units per shift | 200 |
| C-02 | Shifts a year (3 shifts, 230 days) | 690 |
| C-03 | Modules a year at rate (C-01 × C-02) | 138 000 |
| C-04 | First-pass yield at EOL, today | 85 % |
| C-05 | First-pass yield at EOL, modelled | 87 % |
| C-06 | Rework cost per NOK module | €150 |
| C-07 | Scrap cost per NOK module | €1 500 |
| C-08 | Share of NOK that is reworked (rest scrap) | 75 % |
| C-09 | Weeks from SOP to rate, plan | 26 |
| C-10 | Weeks from SOP to rate, modelled | 22 |
| C-11 | Units per shift at SOP | 60 |
| C-12 | Contribution margin per module | €120 |
| C-13 | Shifts a week during ramp | 15 |
| C-14 | Station 040 cycle vs takt, s | 104 / 100 |
| C-15 | Steady-state shifts a year (after week 22) | 360 |
| C-16 | Genealogy lookups a year | 300 |
| C-17 | Minutes per lookup, today / modelled | 45 / 5 |
| C-18 | Loaded hourly cost, quality engineer | €65 |
| C-19 | Audit preparation hours, today / modelled, × 4 audits | 24 / 8 |
| C-20 | Containment scope, serials, today | 600 |
| C-21 | Containment scope, serials, modelled | 120 |
| C-22 | Containment events a year (in plant) | 6 |
| C-23 | Handling cost per contained serial | €60 |
| C-24 | Field events a year (one in four years) | 0,25 |
| C-25 | Field cost per serial in scope | €2 500 |
Sources PUBLIC: archived as text under _evidence/
| S1 | Fraunhofer FFB, battery-production ramp-up: scrap 15–30 % in the first years, ~10 % after five; ~€30 000 a day per scrap point in cell production |
| S2 | ADAC / KBA recall statistics: 532 recalls in 2025 vs 185 in 2010; 2,84 m vehicles in 2024, +48 % |
| S3 | KBA, product-recall procedure: scope defined by the manufacturer |
| S4 | VDA, 8D method: D3 containment with documented scope |
| S5 | Regulation (EU) 2023/1542, battery passport from 18 Feb 2027 for batteries above 2 kWh, via Battery Pass consortium summary |
| S6 | Trade press, PHEV battery recall: ~€400 m for ~30 000 vehicles |
| S7 | Trade press, EV battery recall autumn 2026: almost 100 000 vehicles |
Results DERIVED: formula · value · at half / double the lever
| ID | Formula | Value | ½ / 2× |
|---|---|---|---|
| R-01 | (C-05 − C-04) × C-03 × [C-08 × C-06 + (1 − C-08) × C-07] = 2 760 × €487,50 | €1 345 500 | 673 k / 2 691 k |
| R-02 | ½ × (C-01 − C-11) × (C-09 − C-10) × C-13 × C-12 = 4 200 × €120, weakest | €504 000 | 252 k / 1 008 k |
| R-03 | (200 − 200 × 100 / 104) ≈ 8 units × C-15 × C-12 | €345 600 | 173 k / 691 k |
| R-04 | C-16 × (45 − 5) / 60 × C-18 + 4 × (24 − 8) × C-18 | €17 160 | 10,7 k / 30,2 k |
| R-05 | (C-20 − C-21) × C-22 × C-23 = 480 × 6 × €60 | €172 800 | 86 k / 216 k* |
| R-06 | (C-20 − C-21) × C-24 × C-25 = 480 × 0,25 × €2 500 | €300 000 | 150 k / 600 k |
| Σ | R-01 + R-02 + R-03 + R-04 + R-05 + R-06, each counted once | €2 685 060 |
* R-05 at double is capped: the scope cannot fall below zero serials. "Lever" is the input that moves: FPY gain (R-01), weeks taken off the ramp (R-02), units regained per shift (R-03), lookups a year (R-04), serials taken out of scope (R-05), field events a year (R-06). MODELLED
What the deployment is built on