Portfolio statementSheet 1 of 7
Pragmatos · property developer, owner-operator · industry archetype

Seven buildings,
one energy record

A mixed-use campus of offices, flats and retail, 84,000 m² lettable, owned building by building and run as one estate. In one quarter the asset team is asked for kWh/m²·a by a lender, for CO₂e by the ESG report, for monthly consumption by a tenant, for the annual peak in kW by the grid operator and for an energy management system by the auditor. This statement shows how the campus answers from one record, what that record is worth to the owner each year in found energy and avoided days, and where the read paths stop.

Lettable area84,000 m²
Buildings7 A to G, built 1998 to 2021
Use46 / 22 / 16 thousand m² offices / flats (260) / retail
Energy centre3.2 MW district heat · 2 × 400 kW heat pumps · 3 × 800 kW chillers
On the roofs and in the car park1.1 MWp PV, 48 × 22 kW chargers
Metering7 mains, 118 sub-meters, 9 heat meters
Electricity, a year9.8 GWh landlord 4.1, tenants 5.7
Heat supplied, a year6.4 GWh district heat 4.8, heat pumps 1.6
Intensity193 kWh/m²·a and about 56 kg CO₂e/m²·a on the owner's factors
Head of asset managementThe €/m²·a on the service-charge lines signed off each year, and the lender's covenant on measured kWh/m²·a per building, not per certificate.
Technical property managerWhich chiller carried load on an empty floor last Sunday, and which 15-minute block set next year's capacity charge.
ESG leadkg CO₂e/m²·a per building, four years back, the same figure in the CSRD data point, the lender's annex and the CRREM tool.
MODELLED €90,590 a year €1.08 per m²·a Four positions on the annual statement, sheet 6. Every input and its arithmetic on sheet 7. CO₂e, the CRREM year and PV are shown, not counted.
LoomLivePulseOrbisFlowDecisionsCommand each named once on sheet 4, where it does its work
Pragmatos · Crius Software · property developer, owner-operator, industry archetypeRead-only throughout: Pragmatos reads meters and plant, proposes, and people act
Site registerSheet 2 of 7

Building by building: what is metered, and how it is read

The register the interface survey of weeks 0 to 2 produces. A point is counted only where its read path is confirmed on the campus's own equipment; a meter without a path stays in the register as a gap, not as a claim. Building automation is read where it offers an interface and left alone where it does not. Nothing is written to it in either case.

BldgUse · builtm²Heat and coolingWhat is meteredRead path
AOffices, 14 floors · 199814,000District heat; chillers 1 and 2Main LV meter, 14 floor sub-meters, 2 chiller feedsMeters: Modbus TCP in the LV room. Automation: no readable interface, stays as it is
BOffices · 200812,000District heat; chiller 3Main meter, 12 floor sub-meters, 3 air-handler feedsMeters: Modbus TCP. Automation: BACnet/IP, read only, counted once the survey confirms it on the site controller
COffices · 201610,000Heat pump 1; free coolingMain meter, 10 sub-meters, heat meter at the riserMeters: Modbus TCP. Plant controller: OPC UA, read only
DOffices over shops · 200410,000District heat; chiller 3Main meter, 10 sub-meters, kitchen extract feedsMeters: Modbus TCP. Automation: no readable interface
E140 flats · 201912,000Heat pump 2, district heat top-upLandlord meter, 4 riser heat meters; 140 flat meters with the metering serviceLandlord meter: Modbus TCP. Riser heat meters: pulse output into an I/O box. Flat meters: the metering service's monthly file
F120 flats · 202110,000Heat pump 2Landlord meter, 3 riser heat meters; 120 flat meters with the metering serviceAs E
GRetail arcade, food court, fitness · 201216,000District heat; chillers 1 and 2; cold roomsMain meter, 46 unit sub-meters, 6 cold-room temperature sensors, 12 PV inverters on the roofMeters: Modbus TCP. Sensors: MQTT. Inverters: SunSpec Modbus
ECEnergy centre · 2003, extended 2019–Transfer station 3.2 MW; heat pumps 2 × 400 kWth; chillers 3 × 800 kW; 48 chargersHeat meter at the transfer station; a meter on each heat pump, chiller and pump group; the charger distribution board; 4 car-park lighting zonesHeat meter: pulse output, its M-Bus not read natively. Plant: Modbus TCP. Chargers: the sub-meter on their board, not the charger protocol
Campus84,000152 read points: 7 mains, 118 sub-meters, 9 heat meters, 6 sensors, 12 inverters. 144 confirmed in the survey, 8 waiting on a pulse module or an export file. Flat meters are not points on this record.
Where the read paths stop
  • The automation in A and D has no interface a third party can read; those buildings are read at their meters, and the FM contractor's operators change schedules in the automation from what the record shows.
  • BACnet/IP in B is a read path once the survey has confirmed it on the site controller; until then B is read at its meters.
  • The nine heat meters speak M-Bus, which is not read natively; each is read through its pulse output, and the district-heat supplier's monthly file is loaded as a check on the transfer-station meter.
  • Flat meters stay with the metering service, which also issues the monthly information under HeizkostenV §6a. The record carries risers and building totals, and shows no figure that describes fewer than five people.
  • The charger protocol is not a read path. Charging energy comes from the sub-meter on the charger board.
  • Lighting buses are out of scope; lighting is read at its sub-meter.
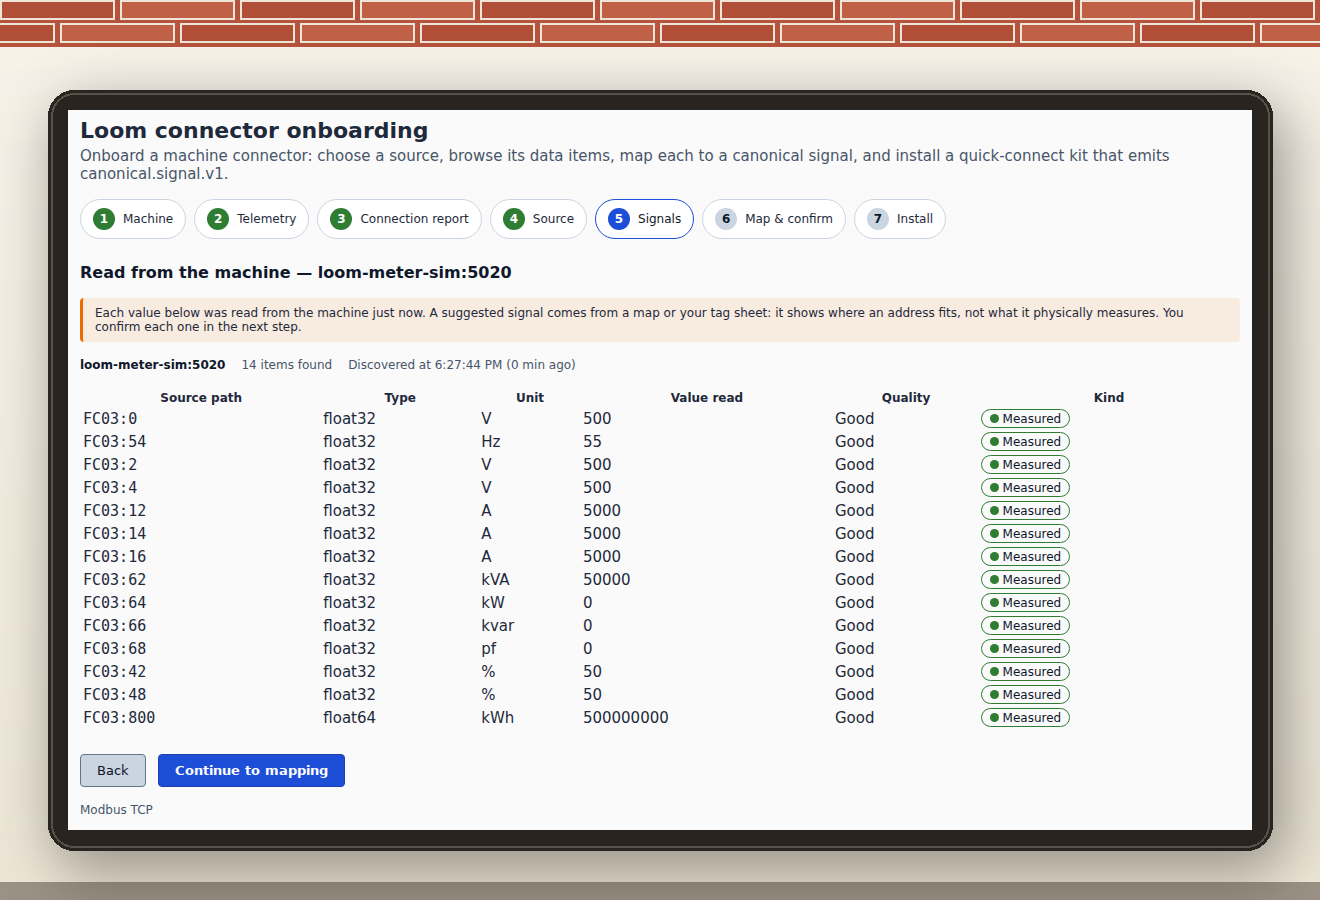
Loom connector onboarding, step 5: fourteen registers read from a Modbus TCP meter, each marked Measured, before mapping
Loom's connector onboarding, step 5: the registers a Modbus TCP meter returns, each read a moment ago, before a person maps them to signals in step 6. Values from a bench meter, not from a building.
Pragmatos · site registerPoints are counted after the survey, not before
Queries receivedSheet 3 of 7

One quarter's queries, as the asset team receives them

Six query slips. Each carries the line the asker relies on and the public text behind it (S1 to S7, listed on sheet 7), and the person-days the team spends answering it today by pulling invoices, automation exports and metering-service portals building by building. The days add up to 90 a year; they are input C-12.

Q-01 · Lender21 d / a
Refinancing of A and D · covenant schedule, ESG annex
"Which of the seven buildings falls in the worst 16% of the non-residential stock, on measured kWh/m²·a rather than the certificate?"
S1 EPBD recast, 2024: the 16% worst-performing non-residential buildings are renovated by 2030 and the 26% worst-performing by 2033, with national thresholds.
Q-02 · Tenant, building E6 d / a
Heating-cost statement · HeizkostenV §6a
"Where is my monthly consumption information, and what is the greenhouse-gas figure for the district heat on my statement?"
S2 HeizkostenV §6a: with remotely readable meters, consumption information monthly from 1 January 2022; statements for periods from 1 December 2021 show the energy-carrier share and, for district heat, the annual greenhouse-gas emissions.
Q-03 · Grid operator4 d / a
Annual network charge · offtake point, energy centre
"Your annual peak at the offtake point is 2,400 kW. The capacity charge for the year is priced on it."
S3 StromNEV §17(2): the network charge per offtake point is an annual capacity price in €/kW on the annual peak plus an energy price in ct/kWh.
Q-04 · Energy auditor18 d / a
EnEfG §8 · landlord's own final energy 8.9 GWh a year
"Where is the energy management system, which meters feed it, and who signed the last review of the energy baseline?"
S4 EnEfG §8(1): companies whose average annual final energy consumption over the last three years exceeds 7.5 GWh set up an energy or environmental management system. Whether seven owning companies count together is the owner's lawyers' question.
Q-05 · Building authority11 d / a
GEG §56 · A, B, D and G each above 70 kW of plant · deadline end of 2029
"Show that the automation in each of these buildings monitors, logs and analyses the consumption of all main energy carriers and exposes the data over a common, freely configurable interface for vendor-independent evaluation."
S5 GEG §56(1) and (2). The duty sits on the building automation. What this record holds is the vendor-independent evaluation that §56(2) No. 2 points at, read from that automation where it has an interface and from the meters where it does not.
Q-06 · ESG lead, for the board30 d / a
CSRD data points · CRREM misalignment year per building
"Scope 2 per building, four years back, on the same basis each year, and the year each building crosses its pathway, for the lender's annex and the sustainability statement."
S6 European Commission on CSRD: under the Omnibus agreement, wave-one companies give no additional information for financial years 2025 and 2026 beyond 2024. S7 CRREM: enter a building's current intensity and expected annual improvement to see when it crosses the pathway.
What the six slips have in common Each asks for a figure per building, measured, on a basis that does not move from year to year, with a trail to the meter it came from. Today each answer is assembled from seven buildings' invoices, three metering-service portals, two automation systems' exports and the district-heat supplier's file, by hand, each time. The record on sheet 4 holds the same figures once, with their state and their source beside them.
Pragmatos · queries receivedDays per slip are this campus's inputs; replace them with yours on sheet 7
One recordSheet 4 of 7

The campus's energy flows, with a read tap on each

Campus energy flows: grid, district heat and PV into the energy centre, heat pumps and chillers, out to buildings A to G and the chargers, each with a read tap feeding one record Grid offtake2,400 kW annual peak District heattransfer station, 3.2 MW PV, 12 inverters1.1 MWp, roof of G Energy centre LV main distributionlandlord 4.1 GWh · tenants 5.7 GWh Heat pumps2 × 400 kWth Chillers3 × 800 kW Heat and chilled-water mains9 heat meters on risers and station Charger board48 × 22 kW, sub-meter on the board Aoffices · 14 floor sub-meters Boffices · 12 · BACnet/IP, read Coffices · 10 · OPC UA, read Doffices over shops · 10 E140 flats · 4 riser heat meters F120 flats · 3 riser heat meters Gretail · 46 unit sub-meters Building automation stays as it is in every building.Read where it has an interface,never written to. One record · Pragmatos Live company → campus → building → floor → unit, a meter at any level · kWh first, cost where the owner sets a tariffa remainder row per building for what the sub-meters do not explain · state beside every readinga meter out of contact after three polls is shown as out of contact, not as zero · 15-minute values held for four years R= read tap
Loom reads each confirmed point over the path in the register: the Modbus TCP meters every fifteen minutes, the I/O box with the heat-meter pulses every minute, the cold-room sensors as they publish, the inverters, C's plant controller over OPC UA. Each register is mapped to a named signal by a person before it counts.
Live is the record in the bar above. The ESG lead opens building E and sees landlord kWh, riser heat, the remainder row and the base-load line for the week; the technical property manager opens chiller 3 and sees its kW, kvarh and the last block.
Pulse compares each building's fifteen-minute blocks with the same hour the week before and with the day's degree-days, and lists the blocks that do not fit: chiller 2 carrying 310 kW on a Sunday with A empty; heat pump 2 and the district-heat top-up both running on a 9 °C night.
Orbis watches the block that is filling at the grid offtake and, when it is heading past the year's peak, proposes which loads can wait and for how long, with the kW each takes out: the charging pace on the 48 chargers, the start of the third chiller. The technical property manager approves on the phone, or does not.
Flow opens one work order for each approved decision: in the FM contractor's ticket system, on the shift board at the energy centre, or as a message to the person on call, and takes the confirmation back. People act. Pragmatos writes nothing to any machine or building automation.
Decisions keeps who approved what and when, which meter moved afterwards and every rule change, with the readings. That trail answers the auditor's Q-04 and the board's Q-06. Command puts the seven owning companies on one server: each sees its own building, the holding sees all seven, and the export is per company.
kWh per square metre a year by building A to G against the campus mean of 193, with the share of each building's kWh explained by sub-meters kWh/m²·a by building, electricity and heat, with the sub-metered share beneath 236205162198128112262 campusmean 193 ABCDEFG 71%78%92%69%88%94%83% sub-metered
The chart the lender's Q-01 needs: each building against the campus mean, and beneath it how much of each building's kWh the sub-meters explain. The rest is the remainder row.
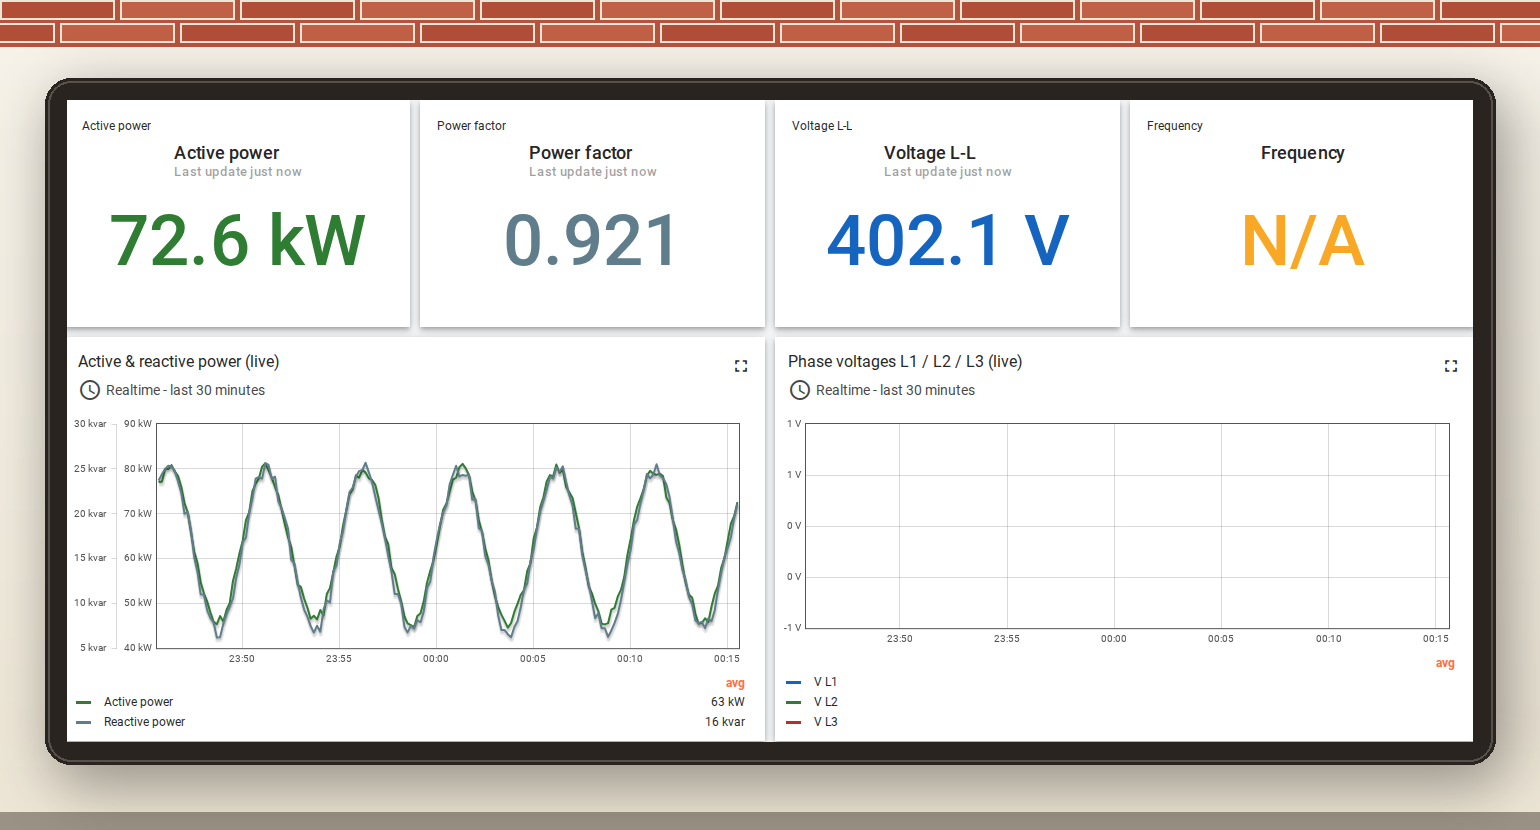
Live, one meter: active power 72.6 kW, power factor 0.921, line voltage 402.1 V, with the last thirty minutes of active and reactive power
Live, one meter as the technical property manager opens it: active power, power factor, voltage and the last thirty minutes of active and reactive power. Values from a bench meter.
Pragmatos · one recordLoom · Live · Pulse · Orbis · Flow · Decisions · Command
PhasingSheet 5 of 7

Sixteen weeks, drawn on the site plan

The rollout is phased by building, the way the campus itself was built. Each plot fills in when its read paths are confirmed; the week numbers on each plot are when it joins the record. Nothing on the plan is a construction job: the heat-meter pulse modules are the only hardware fitted.

Site plan with buildings A to G and the energy centre, shaded by rollout phase with the week each joins the record ABCDEFG Energycentreweeks 3–6 weeks 3–6weeks 7–10weeks 7–10weeks 3–6weeks 11–14weeks 11–14weeks 7–10 PV chargers, 48, car park beneath weeks 3–6 weeks 7–10 weeks 11–14 weeks 0–2 survey, all plots · weeks 15–16 rules and first statement, all plots
  1. Weeks 0–2, survey. Every meter, bus and controller in the register is walked with the FM contractor. Each read path is confirmed on the equipment or written down as a gap. The Modbus TCP meters in the energy centre and in A are read on day 3; the register on sheet 2 is the survey's output.
  2. Weeks 3–6, energy centre, A and D. Pulse modules on the nine heat meters. Chillers, heat pumps, inverters and the charger board on the record. The first fifteen-minute blocks at the grid offtake watched against last year's peak.
  3. Weeks 7–10, B, C and G. B's BACnet/IP read confirmed on the site controller, or B stays at its meters. C's plant controller over OPC UA. G's 46 unit sub-meters and six cold-room sensors.
  4. Weeks 11–14, E and F. Landlord meters and riser heat meters; the metering service's monthly file loaded; building totals only, no figure for fewer than five people.
  5. Weeks 15–16, rules and first statement. A base-load line and degree-day reference per building, the remainder rows, the first monthly export for the ESG lead, and the peak proposals switched on for the next billing year.
How it runs One platform server on the owner's premises or in the owner's own cloud account, and one edge computer in the energy centre. Sign-in through the owner's identity provider; nine roles, so the FM contractor sees plant, the ESG analyst sees buildings and the lender's annex is an export, not a login. Energy values are held for four years at fifteen-minute resolution, which is what Q-06 asks for.

Designed for the EU AI Act's human-oversight and logging requirements: every proposal names its inputs, and a person approves before anything is done. Whether your use meets the Act is for you and your advisers to assess.

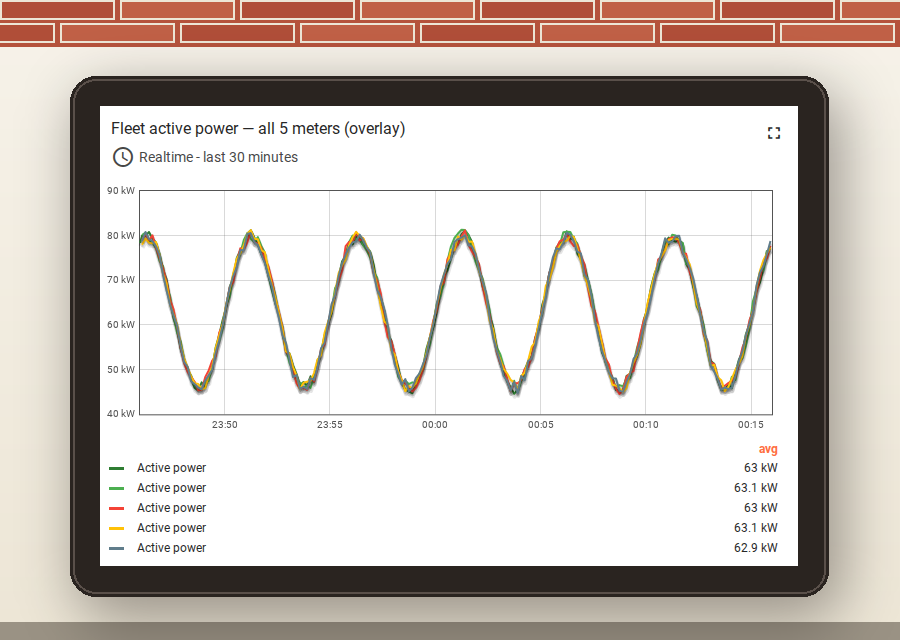
Live, five meters' active power on one chart over the last thirty minutes, with the average of each beneath
Live, five meters on one chart over thirty minutes, the view used at the energy centre's shift board in weeks 3 to 6. Values from bench meters.
Pragmatos · phasingHardware fitted: nine pulse modules. Hardware replaced: none
Annual statementSheet 6 of 7

Four positions, in the units the owner already uses

Set out like the energy lines of a service-charge statement: per position, the basis, today's figure, the figure with the record, and the value in € a year and € per m² of lettable area. Every number is MODELLED from the inputs on sheet 7; the arithmetic is printed there.

PositionBasisTodayWith the record€ a year€ / m²·a
R-01 Evidence days, Q-01 to Q-06Person-days a year assembling the six answers, at €650 a day. The figures sit on the record with meter and state beside them; the days left are reading, checking and signing.90 d30 d39,0000.46
R-02 Landlord electricity found2.5% of 4,100 MWh at €220/MWh. Pulse lists the blocks that do not fit, a chiller carrying load on an empty floor, car-park lighting on through the day; the FM contractor changes the schedule in the automation.4,100 MWh3,997.5 MWh22,5500.27
R-03 Annual peak at the offtake point144 kW off a 2,400 kW peak at a capacity price of €95/kW·a. Orbis proposes which loads can wait in the block that is filling; a person approves; Flow carries the instruction; kWh are unchanged.2,400 kW2,256 kW13,6800.16
R-04 Heat found2% of 6,400 MWh supplied at €120/MWh blended. Riser heat meters against degree-days show the night setback that does not happen and the top-up that runs beside the heat pump; the FM contractor corrects both.6,400 MWh6,272 MWh15,3600.18
TotalMODELLED90,5901.08

Against the landlord's energy lines today, 4,100 MWh of electricity at €220 and 6,400 MWh of heat at €120 come to €1,670,000 a year, or €19.9 per m²·a; the four positions are 5.4% of that line.

If the inputs are half, or double

Position · the input that movesHalfAs modelledDouble
R-01 · days released 30 / 60 / 90 (90 is the ceiling)19,50039,00058,500
R-02 · electricity found 1.25% / 2.5% / 5%11,27522,55045,100
R-03 · peak taken out 72 / 144 / 288 kW6,84013,68027,360
R-04 · heat found 1% / 2% / 4%7,68015,36030,720
Total, € a year45,29590,590161,680
per m²·a0.541.081.92

Weakest position: R-03. It needs loads that can wait and a person who approves inside the block. A campus whose chargers and chillers already stagger has less to take out, and one missed block in December sets the whole year's charge.

Pragmatos · annual statementMODELLED · inputs C-01 to C-19 on sheet 7
Calculation sheetSheet 7 of 7

Inputs, arithmetic and sources

Rows marked ASSUMED are this campus's figures and the first ones an owner replaces with its own; the arithmetic then re-runs unchanged.

RowInputValueWhere from
C-01Lettable area84,000 m²register, sheet 2
C-02Electricity purchased a year9,800 MWh7 main meters
C-03of which landlord supply4,100 MWhenergy-centre meters
C-04of which tenants5,700 MWhshown, not counted
C-05Heat supplied a year6,400 MWh4,800 district heat + 1,600 heat pumps
C-06Electricity price, landlord supply€220/MWhASSUMED
C-07Heat price, blended€120/MWhASSUMED
C-08Capacity price€95/kW·aASSUMED; structure per S3
C-09Annual peak at the offtake point2,400 kWgrid operator, Q-03
C-10Peak taken out144 kW (6%)ASSUMED
C-11Person-day, asset team€650ASSUMED
C-12Evidence days today90 d21+6+4+18+11+30, sheet 3
C-13Evidence days with the record30 dASSUMED, one third
C-14Landlord electricity found2.5%ASSUMED
C-15= landlord electricity found a year102.5 MWhC-03 × C-14
C-16Heat found2%ASSUMED
C-17= heat found a year128 MWhC-05 × C-16
C-18Emission factors, owner's0.38 / 0.20 kg/kWhASSUMED; electricity / district heat
C-19PV yield950 kWh/kWpASSUMED; × 1.1 MWp = 1,045 MWh
ResultArithmetic€ a year
R-01(C-12 − C-13) × C-11 = 60 × 65039,000
R-02C-15 × C-06 = 102.5 × 22022,550
R-03C-10 × C-08 = 144 × 9513,680weakest
R-04C-17 × C-07 = 128 × 12015,360
Total90,590
per m²90,590 ÷ C-011.08
Intensity(C-02 + C-05) ÷ C-01193 kWh/m²·a16,200 ÷ 84,000
CO₂e9,800 × 0.38 + 4,800 × 0.204,684 t55.8 kg/m²·a, shown
EnEfGC-03 + 4,800 district heat8,900 MWhabove the 7.5 GWh of S4
Energy lines4,100 × 220 + 6,400 × 1201,670,000€19.9/m²·a; the four are 5.4%

Sources behind the query slips

S1 European Commission, EPBD page (recast 2024/1275), read 2026-11-03: "renovation of the 16% worst-performing buildings by 2030 and of the 26% worst-performing buildings by 2033".

S2 HeizkostenV §6a, gesetze-im-internet.de, read 2026-11-03: monthly consumption information from 1 January 2022 where meters are remotely readable; §6a(3) energy-carrier share and, for district heat, annual greenhouse-gas emissions.

S3 StromNEV §17(2), gesetze-im-internet.de, read 2026-11-03: capacity price in €/kW on the annual peak plus energy price in ct/kWh, per offtake point.

S4 EnEfG §8(1), gesetze-im-internet.de, read 2026-11-03: more than 7.5 GWh average annual final energy over three years; energy or environmental management system.

S5 GEG §56(1) to (3), gesetze-im-internet.de, read 2026-11-03: non-residential buildings with more than 70 kW of heating, ventilation or cooling plant, by 31 December 2029; §56(2) Nos. 1 to 6.

S6 European Commission, Corporate Sustainability Reporting page, read 2026-11-03: Omnibus I agreement; wave-one companies, no additional information for 2025 and 2026 beyond 2024.

S7 CRREM Foundation, crrem.eu, read 2026-11-03: pathway explorer, "enter your building's current intensity and expected annual improvement to see when (or if) it crosses the CRREM Pathway".

Pragmatos · calculation sheetCrius Software · 2026 · all results MODELLED