![]()
Data Analytics, Visualization & Deep Learning Modules
Derive Business Insight from Data
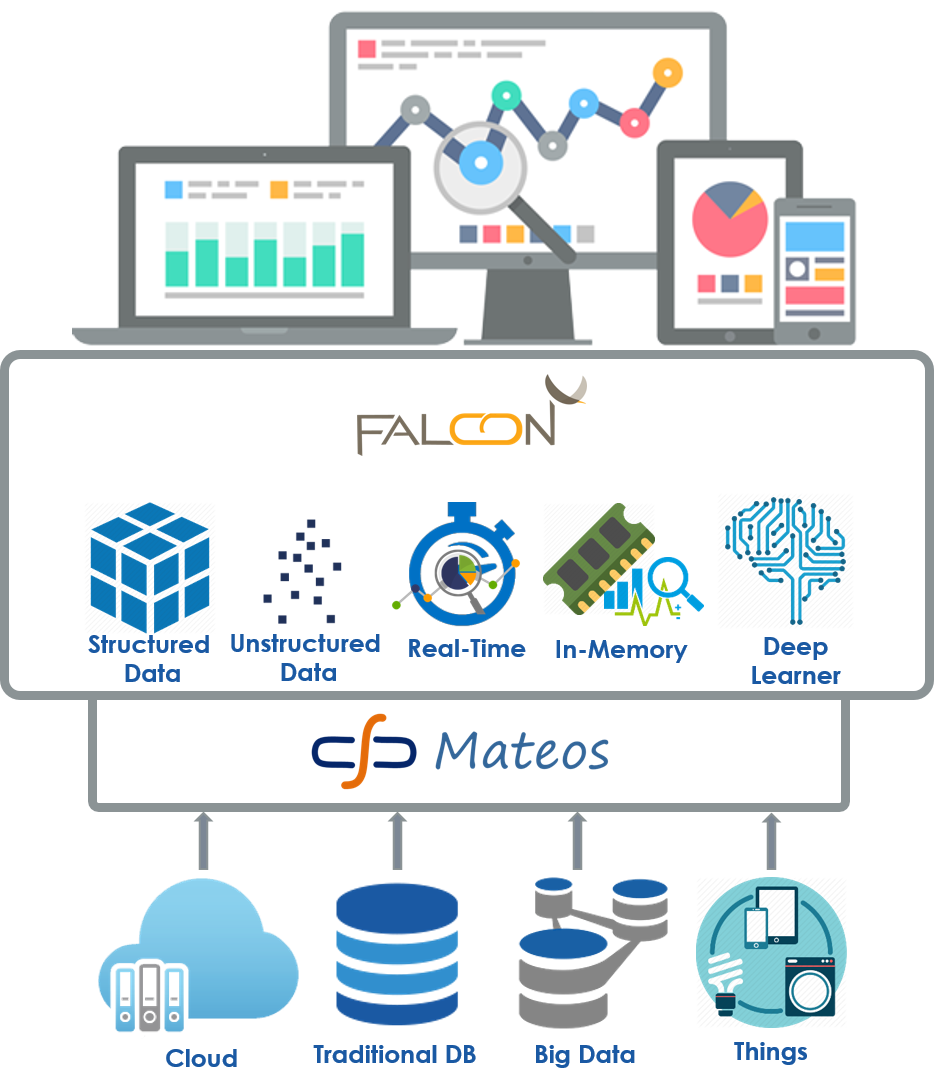
Falcon is a collection of data analytics, visualization & deep learning modules on the Stratos Platform, to extract, transform, analyze patterns, visualize, present and forecast your data that provides deeper business insights.
-
With Mateos® integration platform as the backbone, Falcon extracts data from large volumes of heterogeneous sources – Traditional databases, Random files, Big Data, NoSQL, Data Streams (‘Things’ & Sensors) and unstructured datasets
-
Data Mine, ETL and generate Multidimensional data set for Analysis, Visualization, Self-Help Reporting, Real-time and In-Memory analytics with intuitive dashboards
-
Using Helios app development platform, Embed Analytics, customize your existing applications with data intelligence seamlessly
-
The Python/Keras based Machine/Deep Learning interface allows simple to complex ensemble algorithms in discovering data patterns
Features
Falcon provides a broad range of modules for your tailored analytical needs.
Data mining with Mateos®
The ETL module of Mateos® provides a robust interface to extract, transform and warehouse data from disparate sources ranging from simple data files to large Big Data repositories either as a batch or real-time.
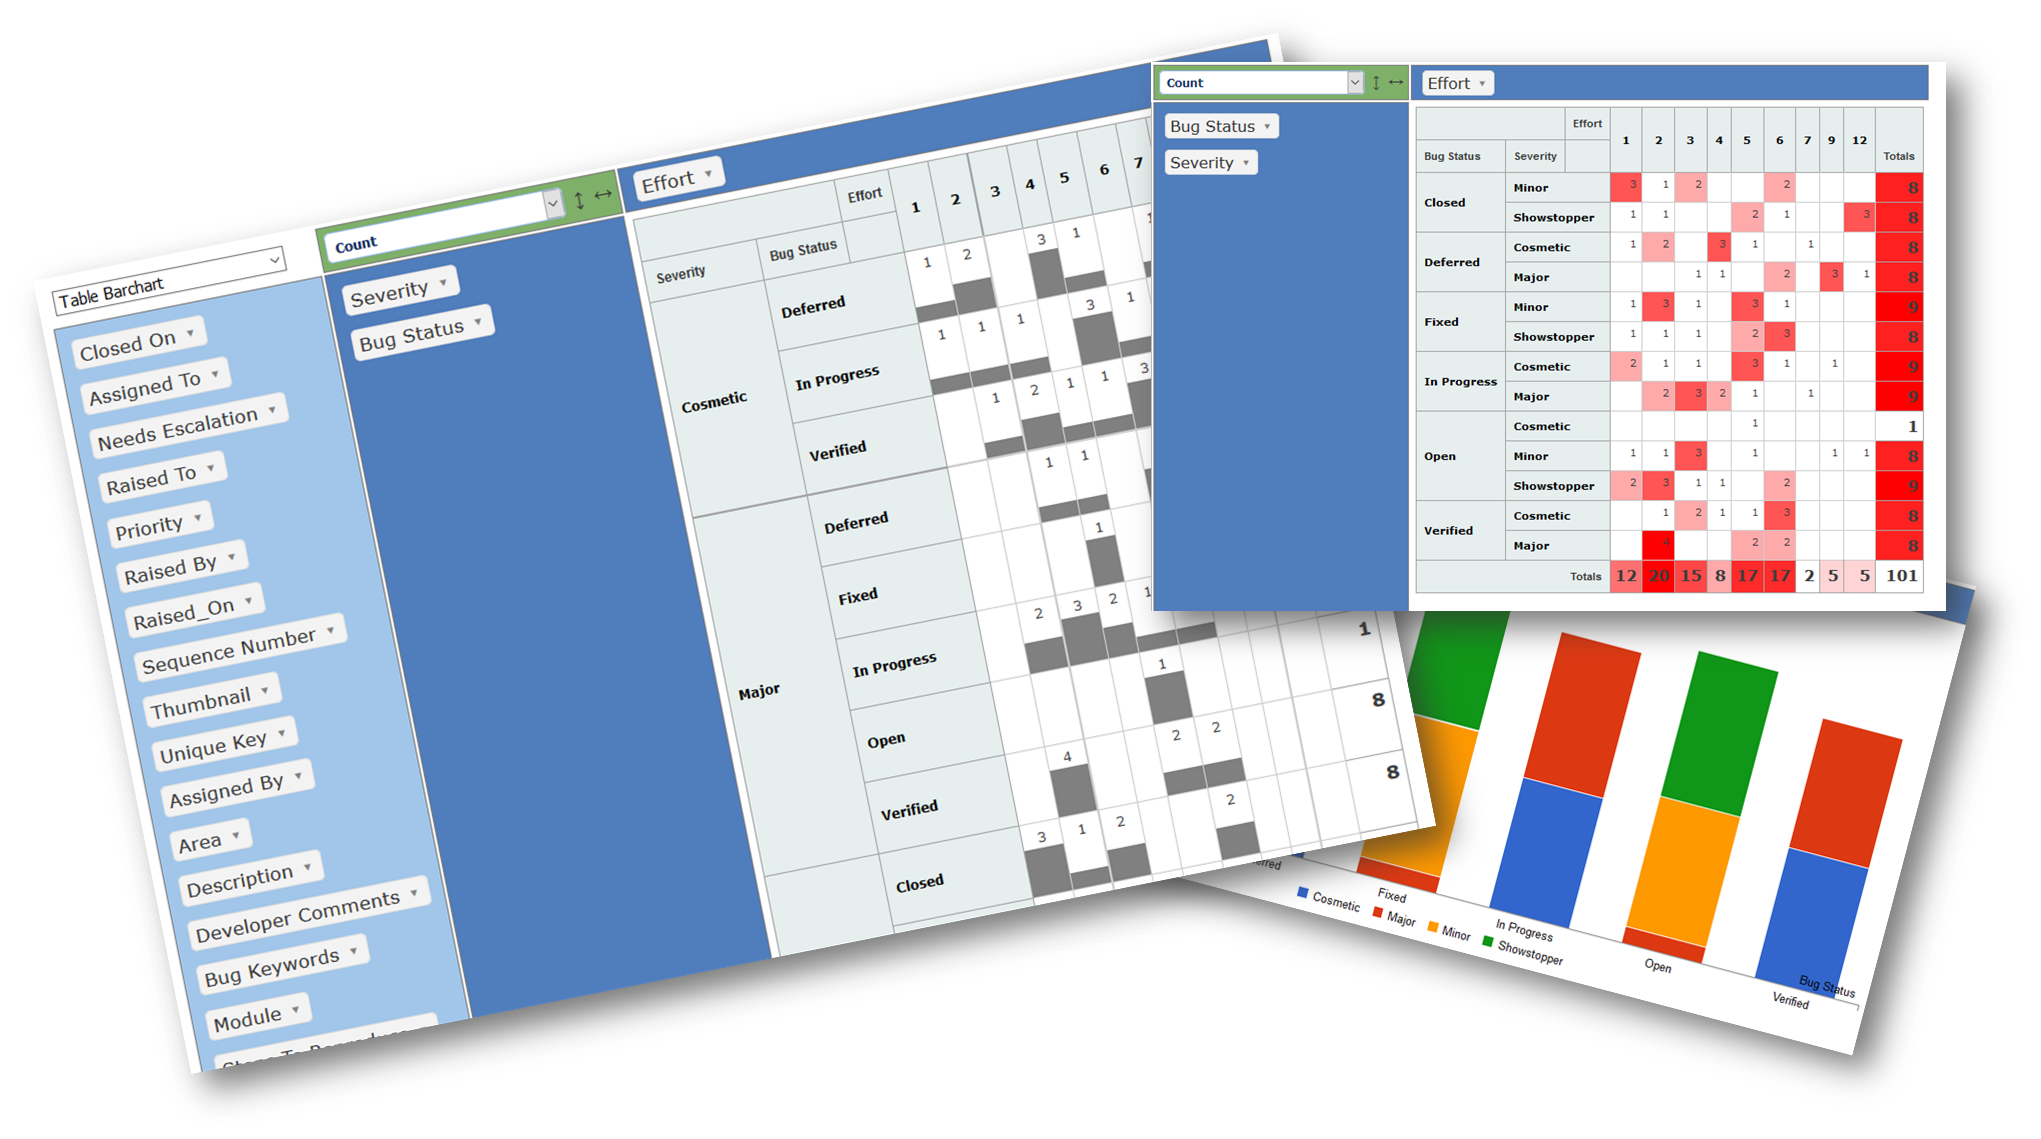
Multidimensional analysis (OLAP)
Falcon provides drill-down, drill-across, slice-and-dice, drill-through processes to browse through your data at different depths and perspectives.
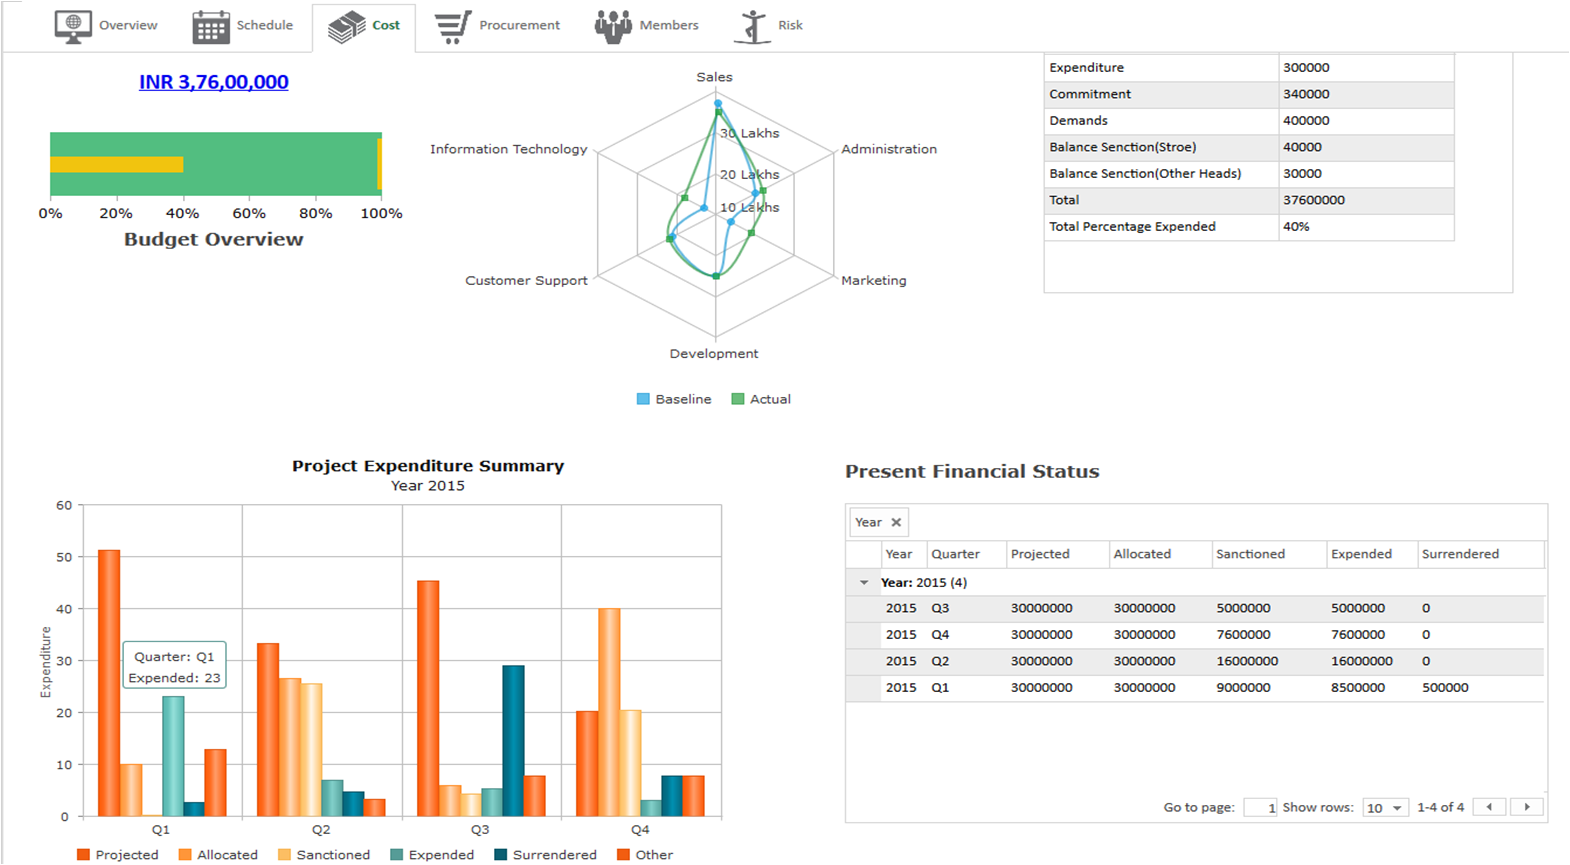
DATA VISUALIZATION
Discover insights in your unstructured business data
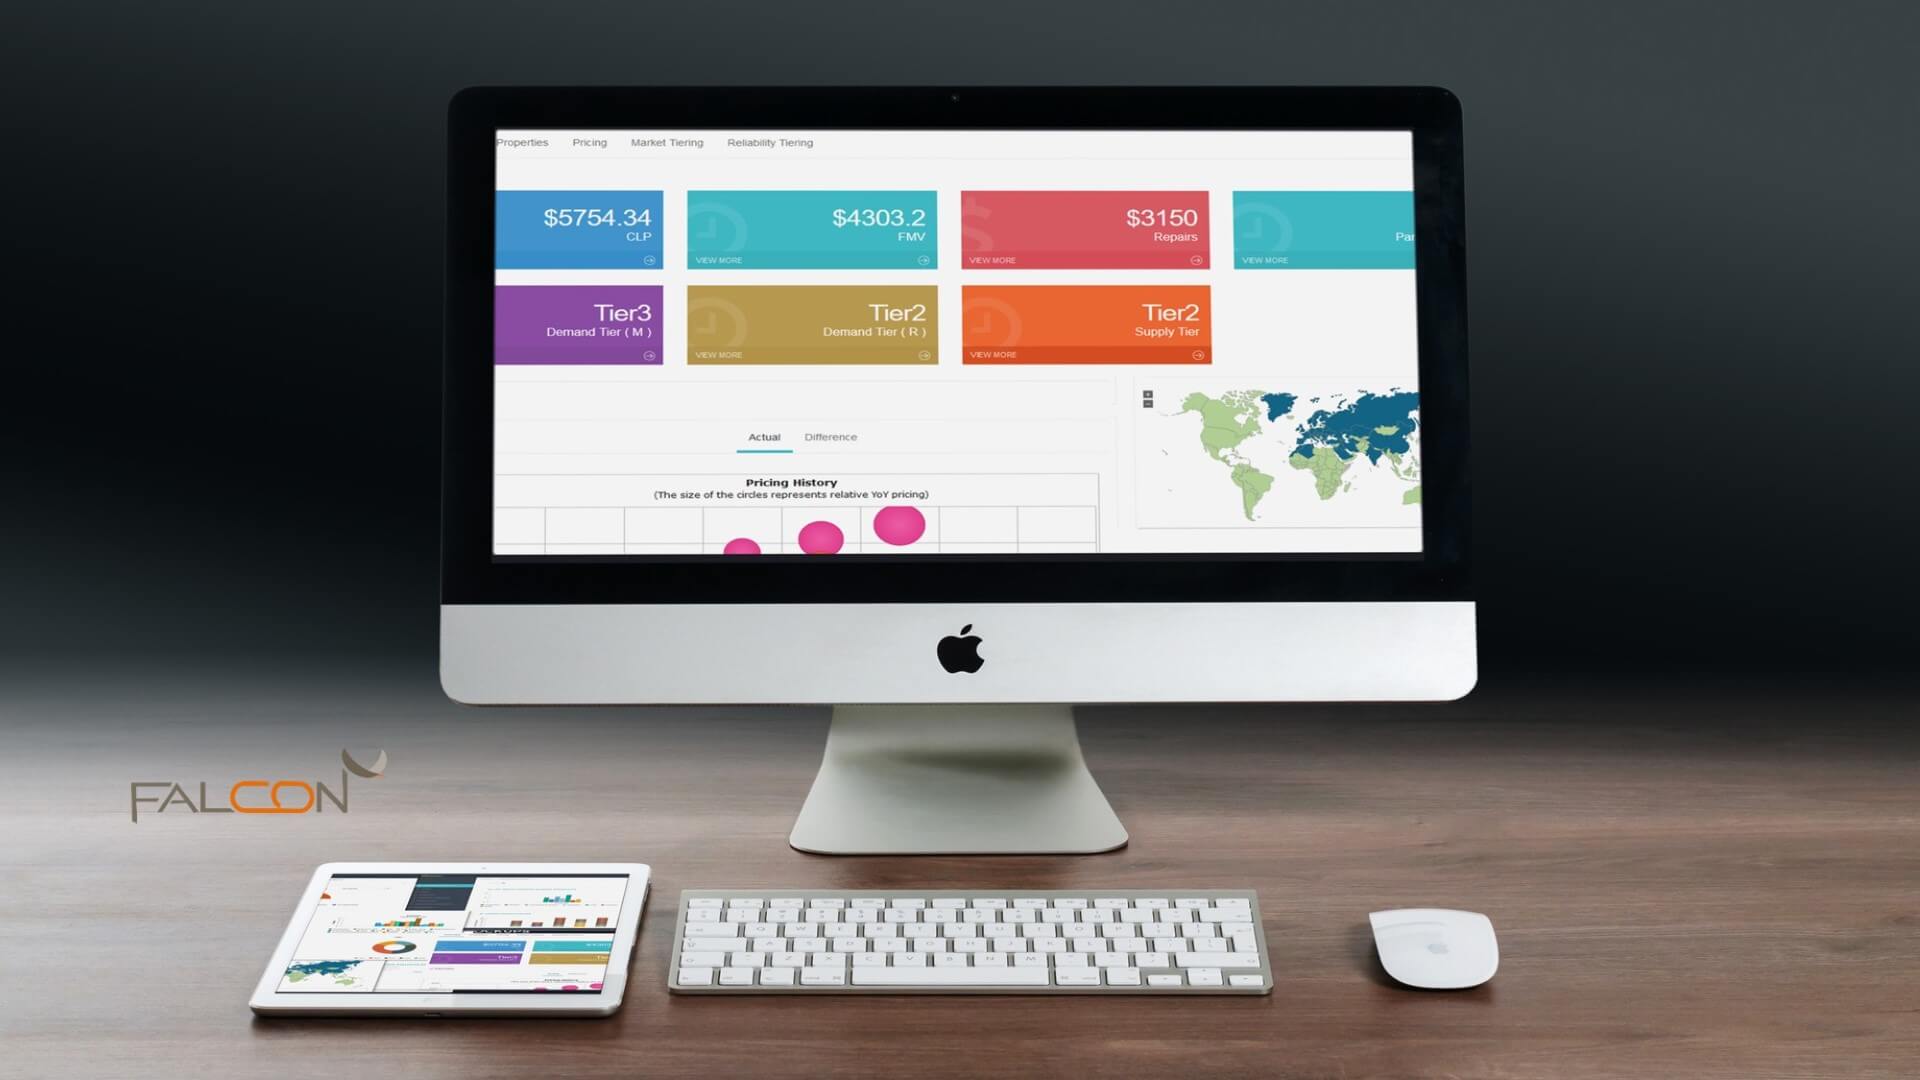
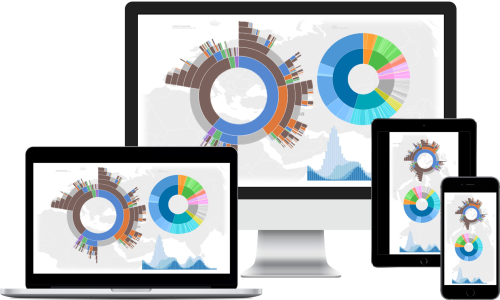
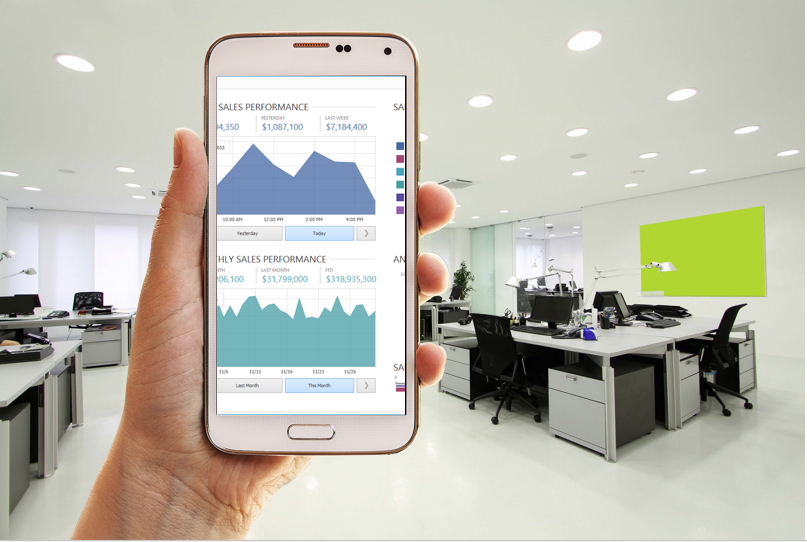
View and analyze your data in enriched dashboards, charts, self-help Widgets, location intelligent maps and other analytical channels for on-demand consumption. Responsive dashboards and widgets allows you in your analysis everywhere – Desktop, Mobile or a tablet.
Falcon enables individuals to absorb larger information and hence identify emerging trends faster. Decision makers can see interconnection between multi-dimensional data sets and provides fresh perspectives to interpret data through trend scatters, bullet charts, heat maps, and other rich graphical representations. It helps discover relationships & patterns between business outcome & operational activities. Discover and analyze how your day-to-day tasks impact your overall business performance, and find out which operational change triggered the growth/dip in business performance.
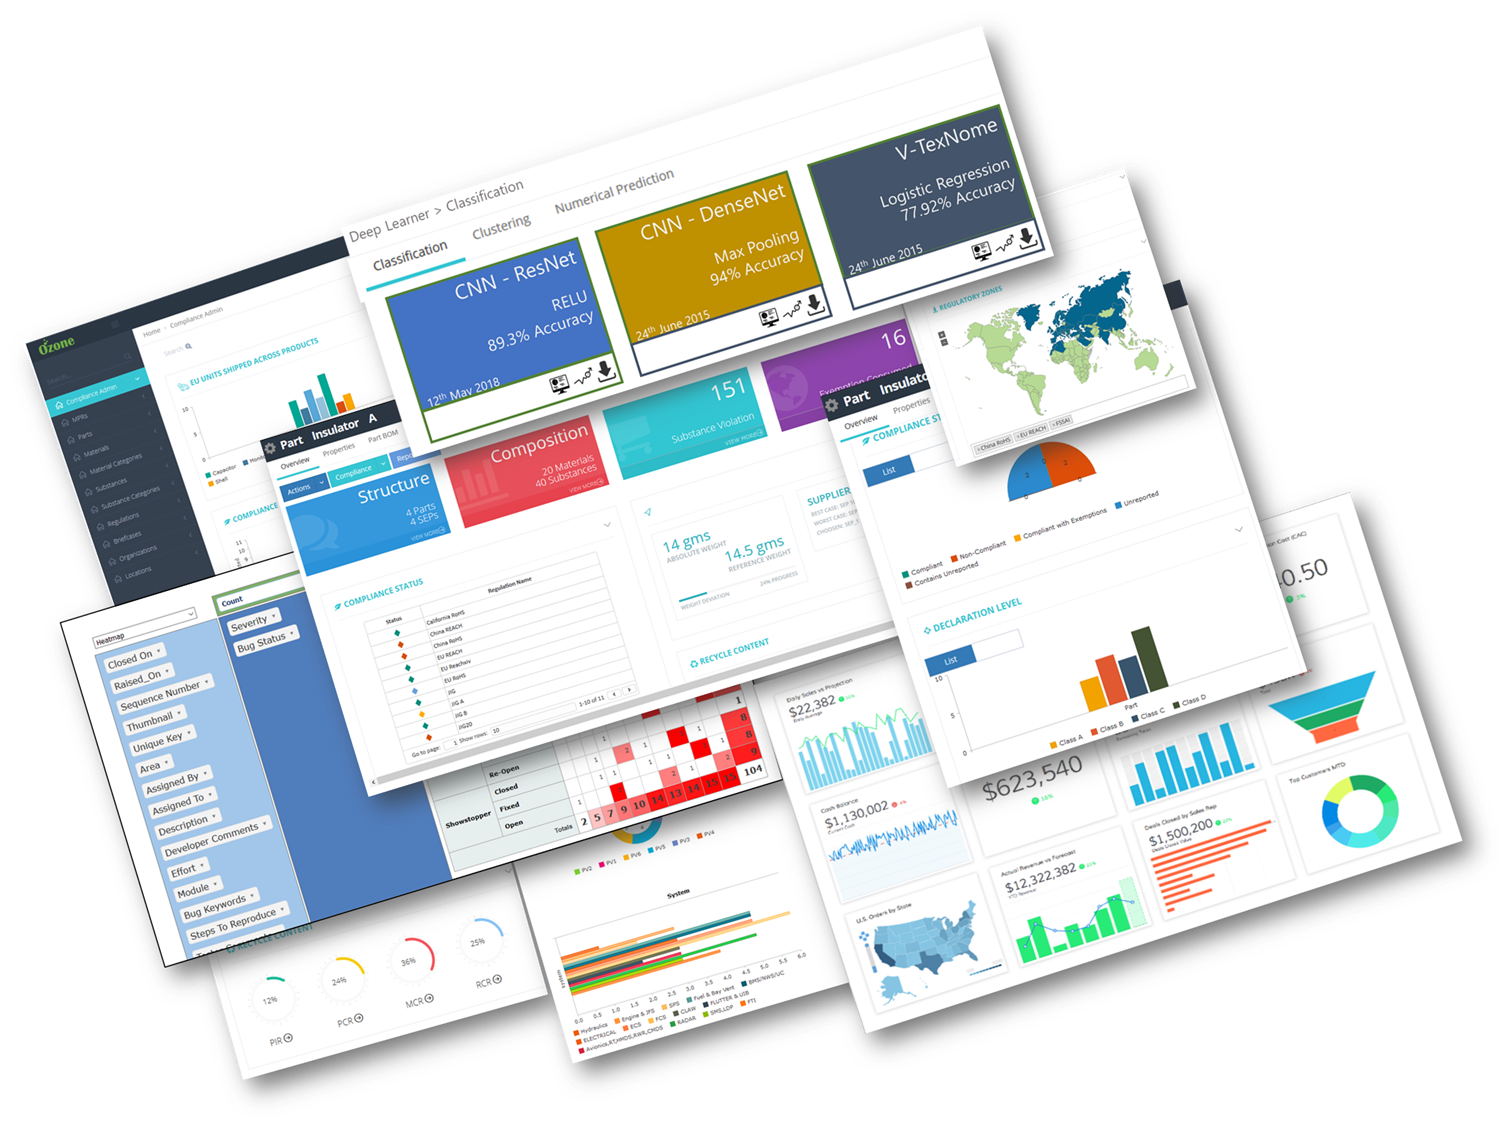
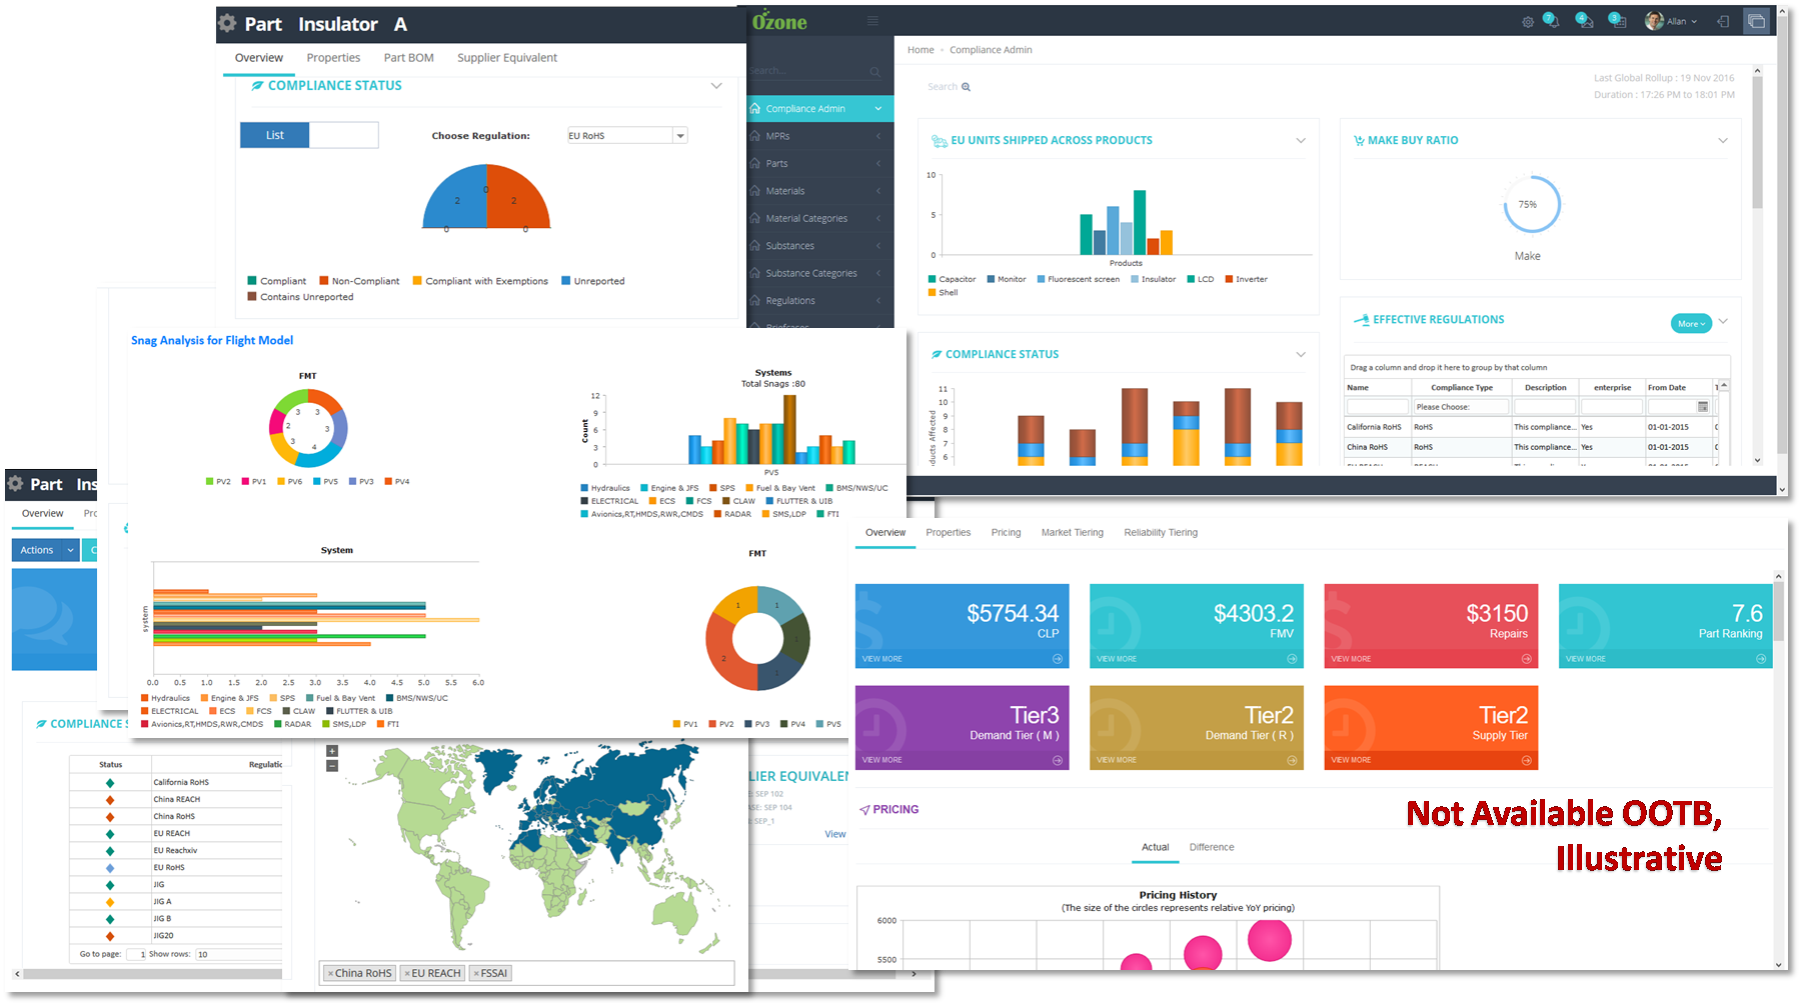
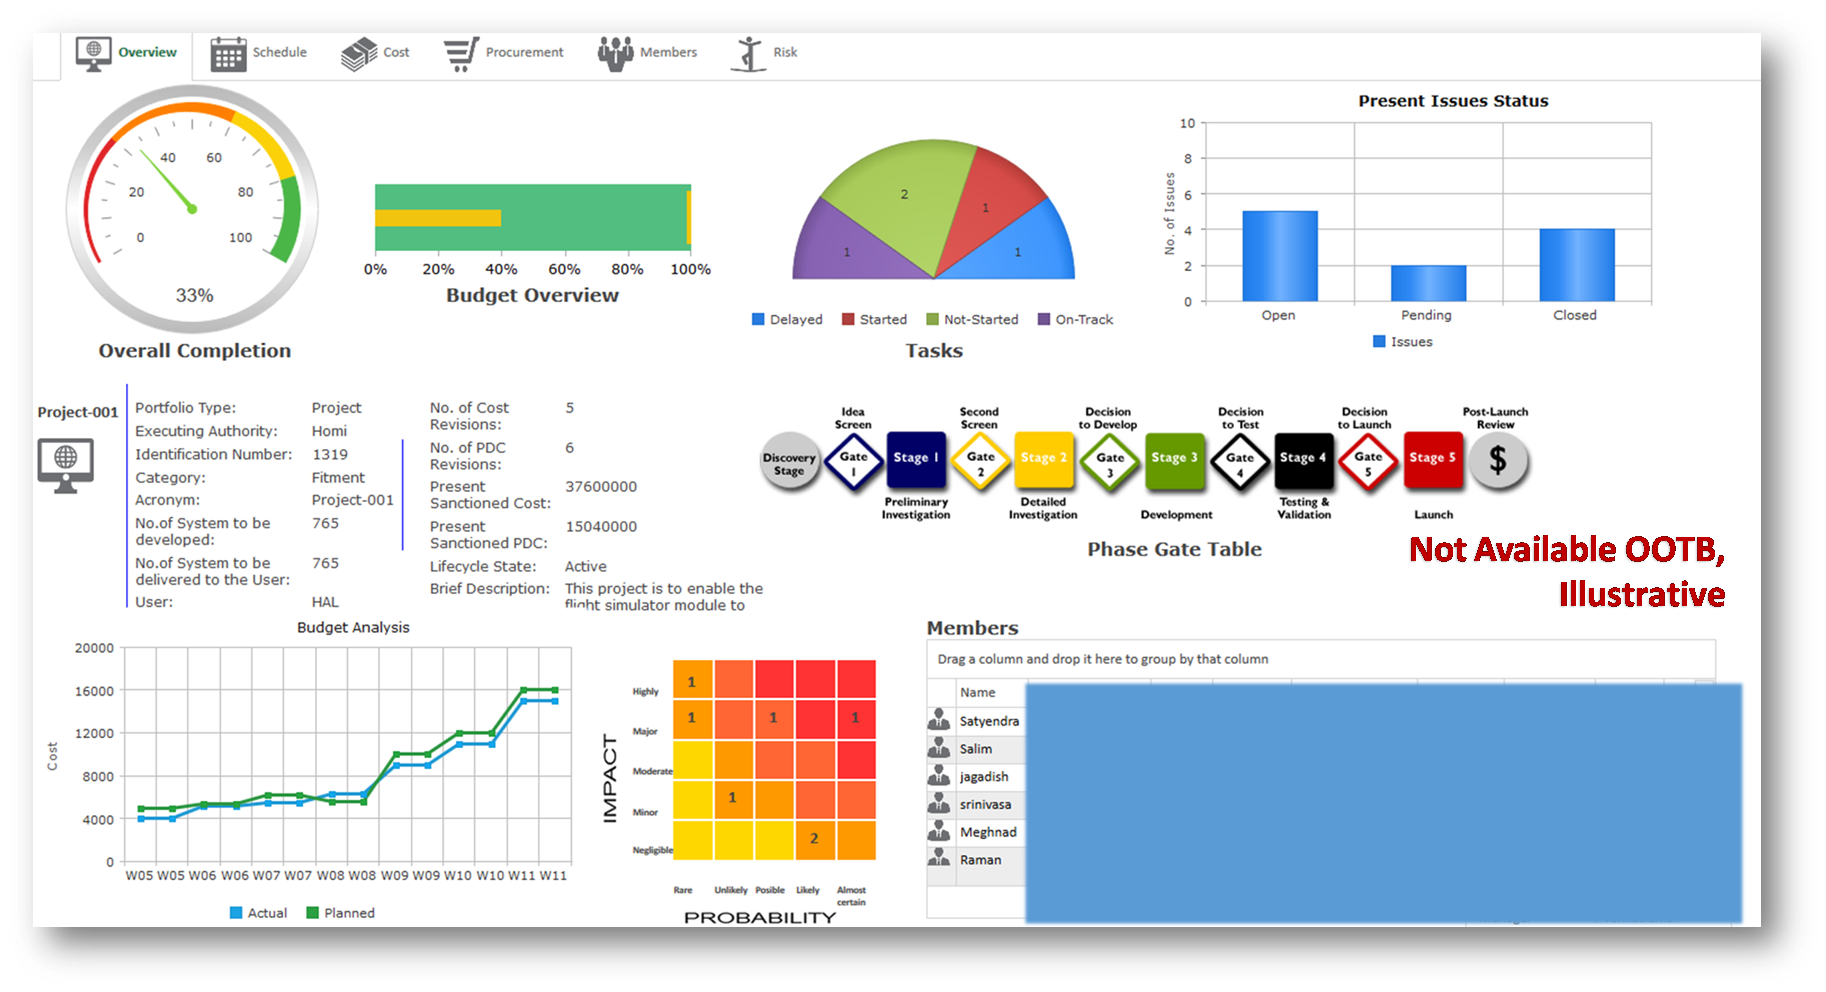
Falcon Gallery:
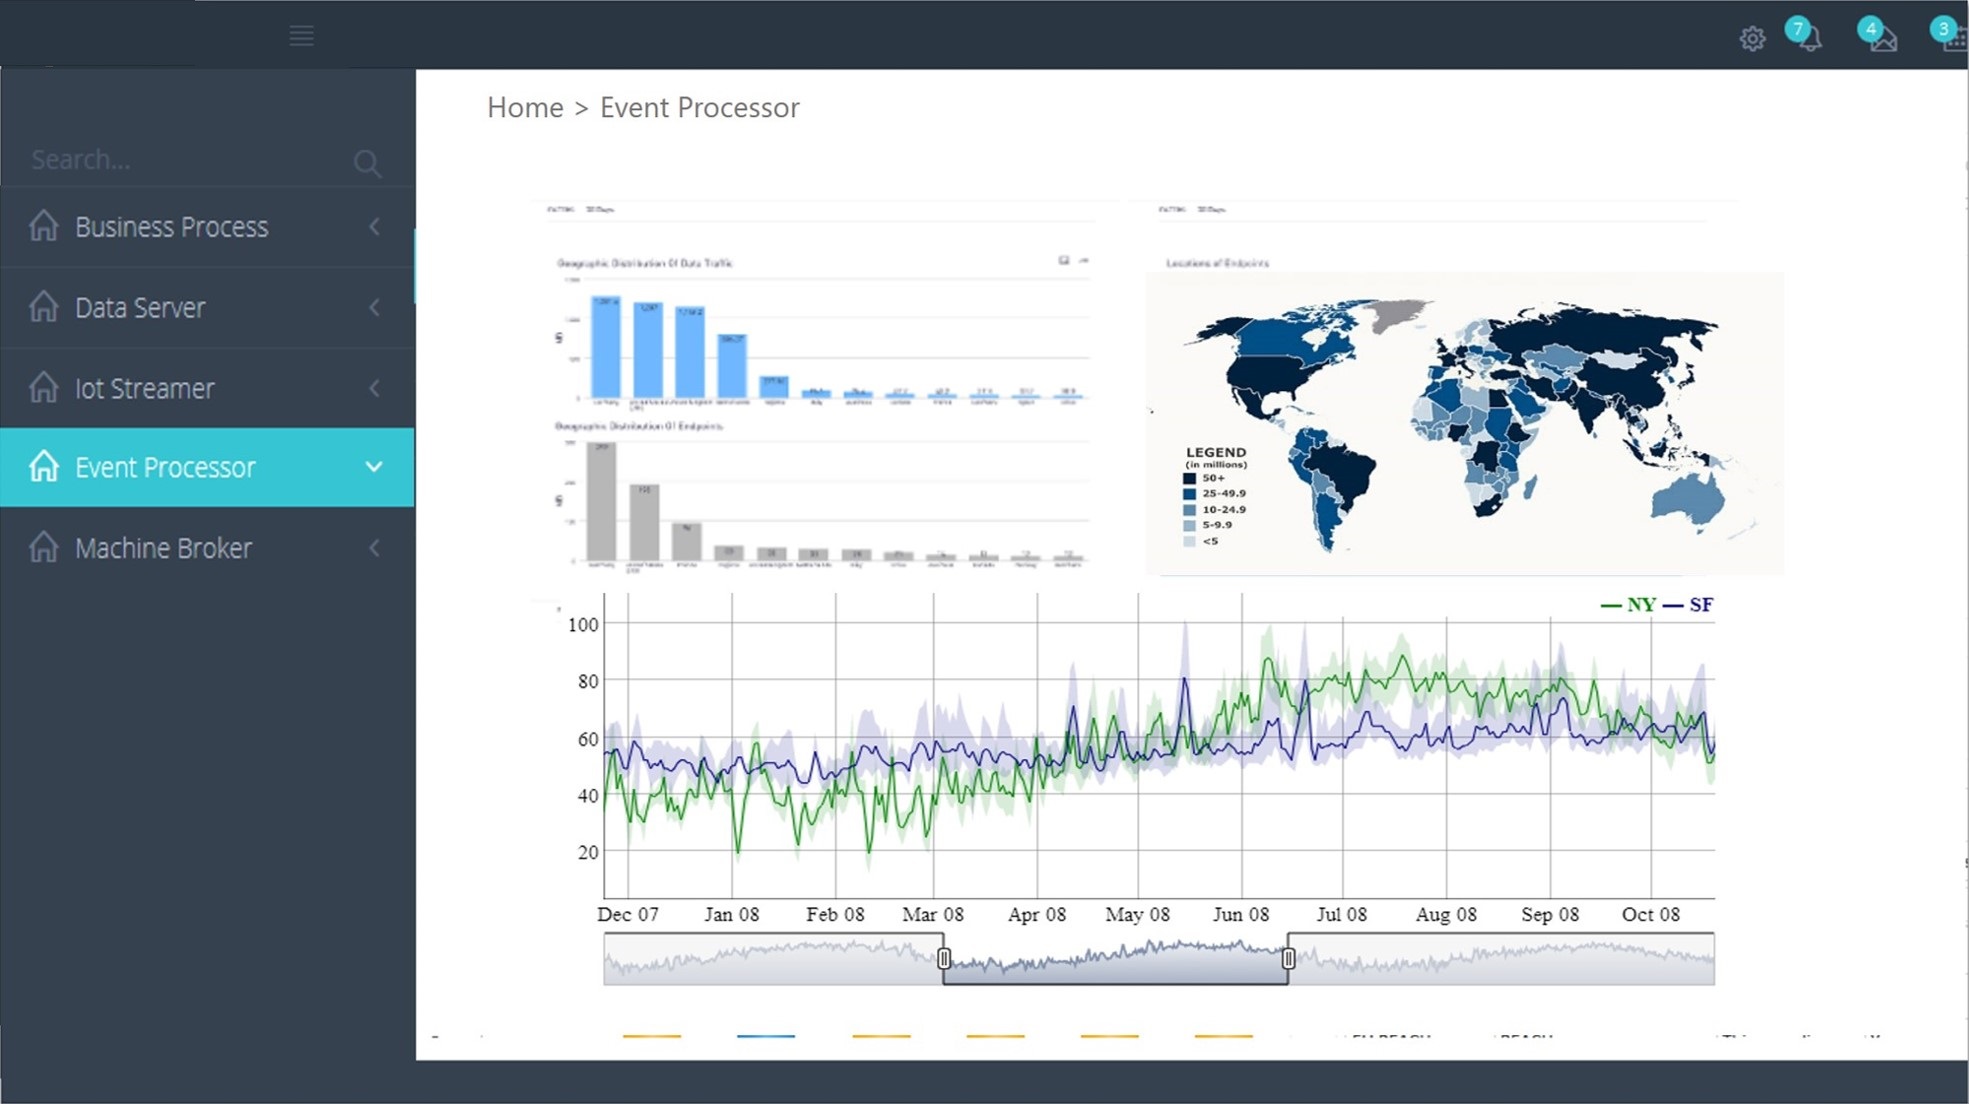
Industry 4.0 & Streaming IoT Analytics
With event driven analytics dashboard, track and analyse data from your machines, sensors, network data and M2M. Either process them from the big data store or use real-time analytics. Combine with enterprise or social data for a thorough and intelligent predictive analysis to uncover data patterns. Use Mateos® integration platform to build Python models and machine and deep learning functions.
Big Data
Falcon can source heterogeneous data from large datasets including NoSQL databases (Mongo DB, Cassandra, Hive and Hbase), HDFS (Hadoop), distributions (Cloudera and Hortonworks) and analytical databases (VectorWise, Teradata and Netezza) or streaming data for real-time analysis.
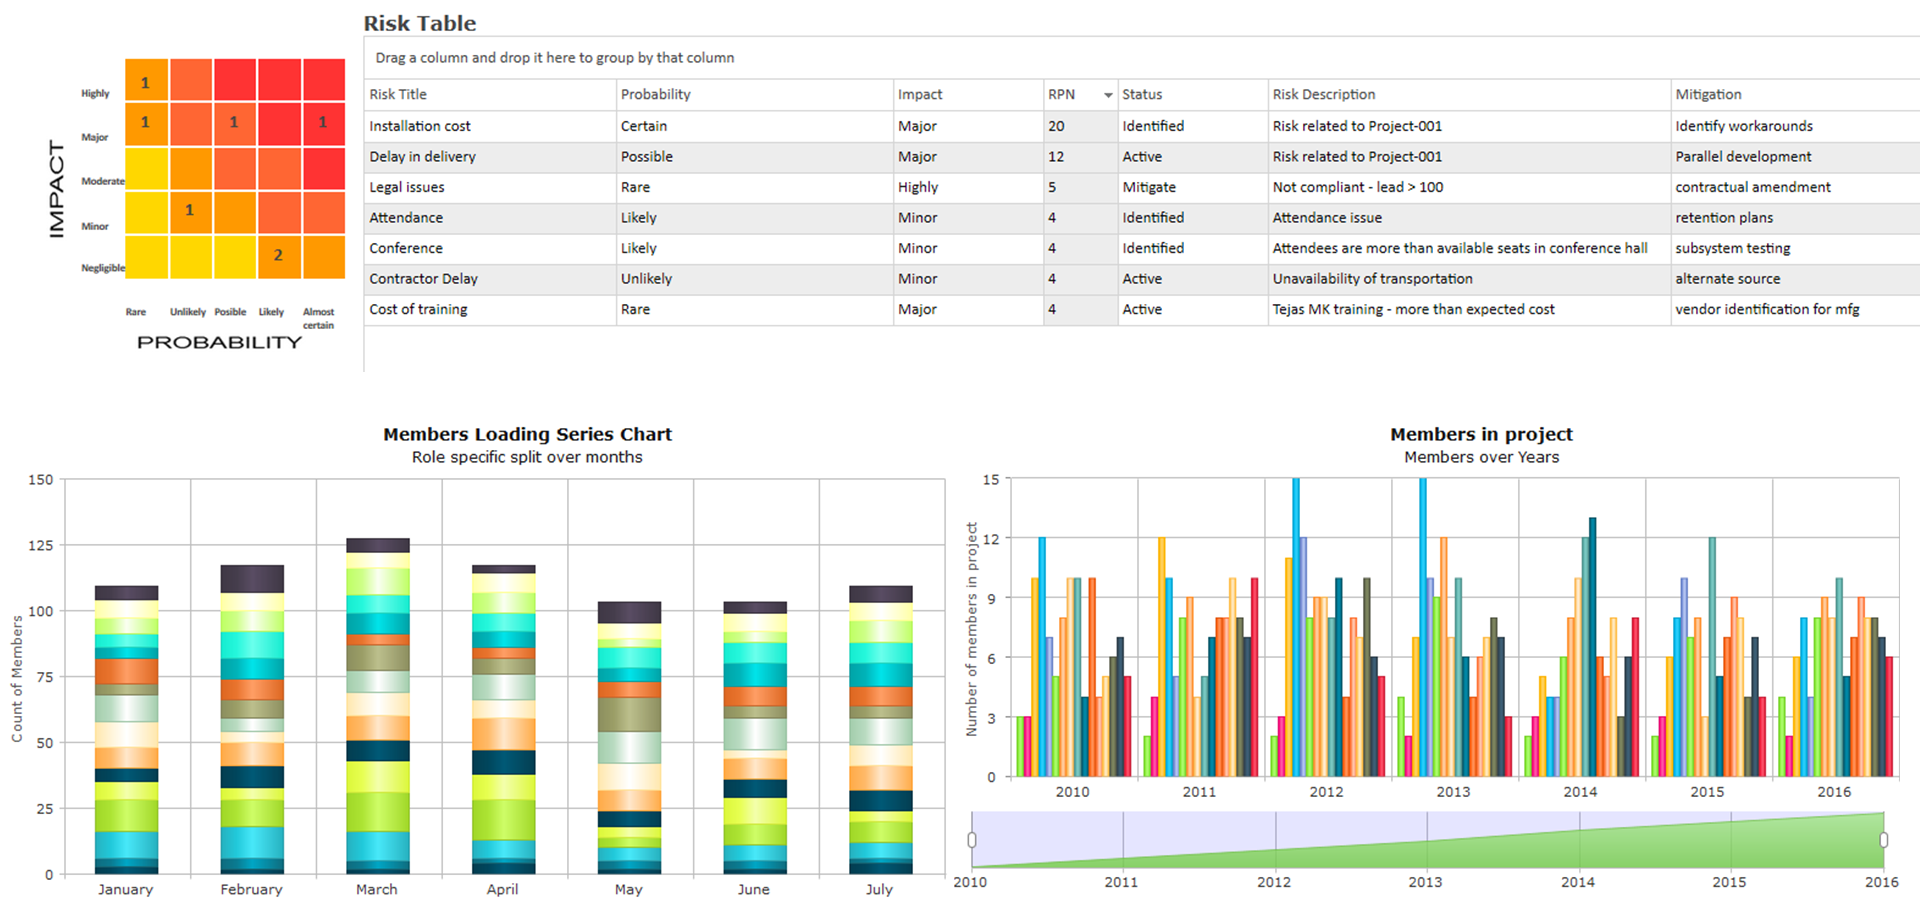
Reporting, Charts, KPI and Dashboards
Aggregate, analyze and export data into several formats of choice - PDF, XLS, JSON, HTML, TXT, CSV, XML, RTF and others. Pre-defined standard charts allows you to graphically analyze and interpret your data as line/area, pie/donut, column/bar/stacked, polar & spider, bubble, scatter, OHLC/Candlestick, logarithmic, self-help pivot and custom multi-series, charts.
Reporting, Charts, KPI and Dashboards
Create, manage, view and navigate Key Parameter Indices (KPI) hierarchy models, through different methodologies, rules/algorithms for calculations, boundaries and alarm rules.
Real-Time
Monitor your streaming data continuously, generate effective business insights and hence re-strategize appropriately. View the result additions through advanced report, KPI, widget or dashboard kits. Dynamically combine historical data with real-time delta for informed decision making and get away with the effort of designing dashboards.
In-Memory Analytics
Quick, smart analysis for a big data world. Â Improve the performance of analytical queries against large data sets for faster business decisions. Beat the glitches in performance with traditional replication, serialization and I/O operations
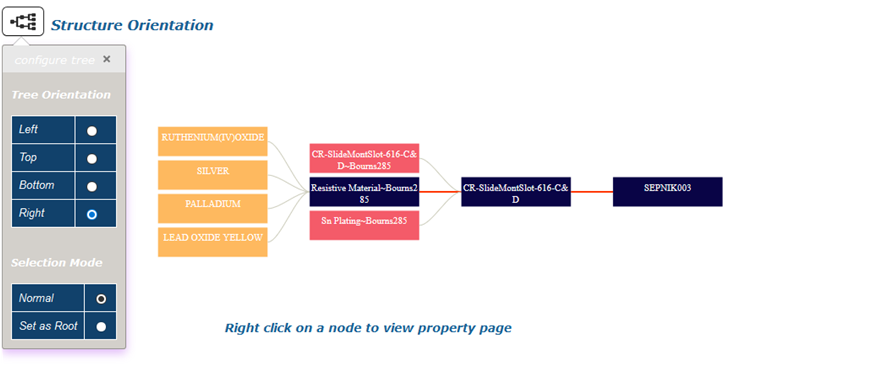
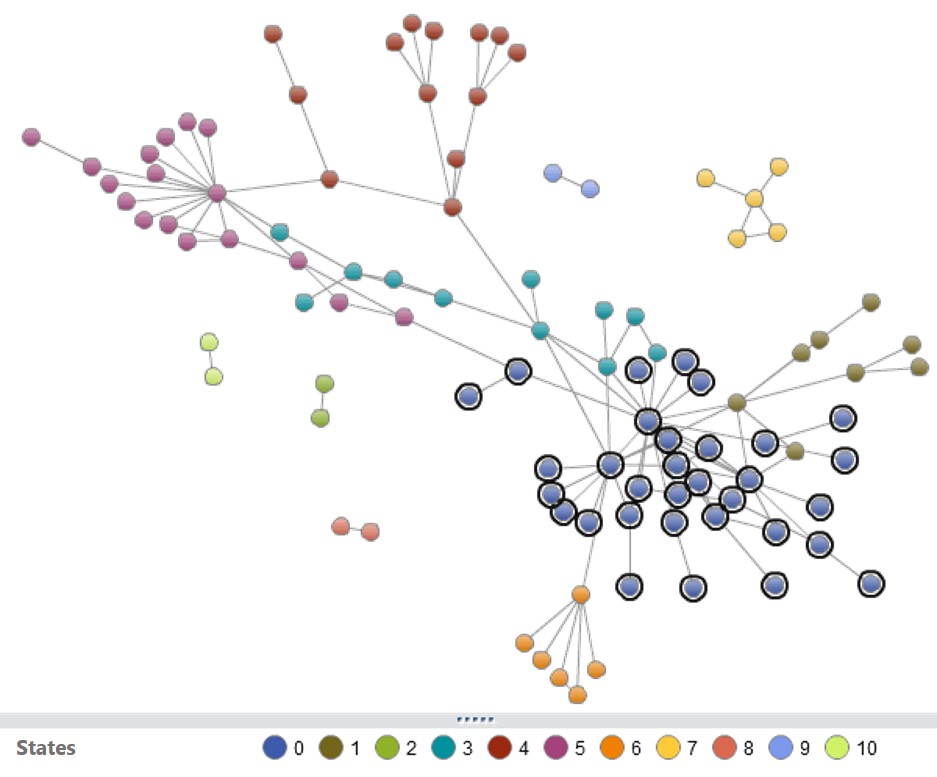
Network Analysis
Aggregate, visualize and interpret entity relations graphically. Dynamic exploration controls help you navigate through the connections easily and establish a network pattern.
What-If Analyzer
Develop and simulate scenarios to predict and analyze trends in your data sets that can provide remedial / potential changes in your business strategies.
What-if analyzer makes multi-dimensional analysis instant to meet emerging decision-making requirements. Instant insights on your data elements are provided at different levels of details and from different perspectives. Drill-down, drill-across, slice-and-dice and drill-through for a thorough evaluation of your data patterns.
Configurable Interactive Widgets
Perform Drag & Drop analysis with data aggregation to explore your data graphically. Define exploration modes to drill through your data set. Merge and form logically connected widgets to configure an intuitive dashboard
Self-Serve Analytics
Build your own data set and visualization with unstructured data in your CSVs, DATs, XLS and legacy databases. Drag & Drop data sets forming queries instantly to build custom pivots, reports, charts and widgets.
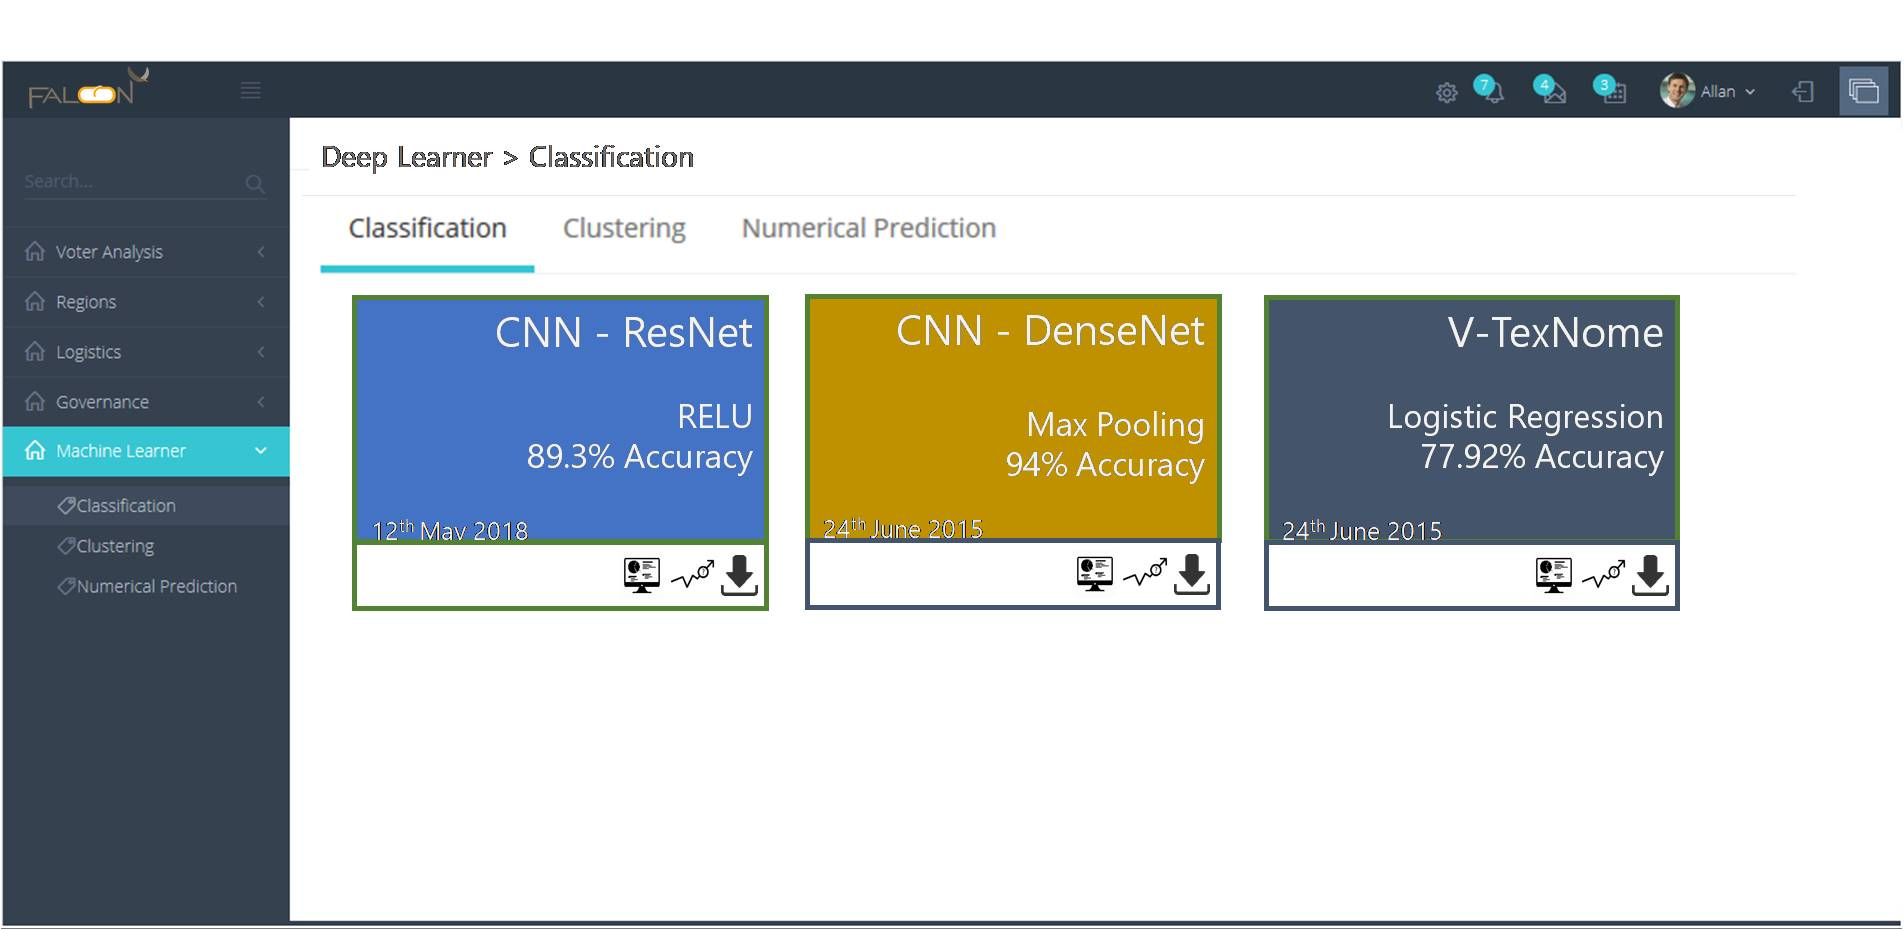
Falcon Deep Learner Interface
Falcon’s Deep Learner helps data analysts build models with predictive intelligence. It can detect data patterns and adjust program actions accordingly and thus helping in data classification, forecasting results, behavioral patterns and anomaly detection.
Falcon Deep Learner Interface
The module allows you to extract datasets from a file system, legacy database or HDFS and apply various machine learning algorithms and present predictive visualization reports to unearth hidden business traits.
How does Falcon help your Business?
-
Actionable Intelligence
With Falcon, you are given accurate data, updates in real time, trending and forecasting ...
-
Quick Answers
Another great incentive for Falcon users is that you can get instant answers to your business queries...
-
Real-Time Decisions
Obtain important business metrics reports whenever and wherever you need them ...
-
Everyone can Analyze
With Falcon, any authorized member in the organization can gain access to important business data ...
-
Data Visualization
Falcon enables individuals to absorb larger information and hence identify emerging trends faster...
-
Self-Service Business Intelligence
Decision makers can use advanced self-service capabilities to create visualizations ...
-
Mobile and Embedded Analytics
Get enhanced information access regardless of time, place or the device/application ...