

Total Site kWh Tells You Nothing: Getting to Energy Per Part on a CNC Fleet
Your energy bill arrives once a month with one number on it. Your customers are starting to ask what a part costs to make, in kilowatt-hours and increasingly in kilograms of CO2. Those two facts are separated by roughly four decisions, and none of them is about buying meters.
This is the companion piece to our article on getting a single OEE number out of a mixed CNC fleet. It is the same shop, the same machines and the same underlying discipline — applied to a different number, and one that has become considerably harder to avoid.
Listen — audio overview
Industrial Reality Check
The bill says the site used 84,000 kWh last month. Nobody disputes it. Nobody can act on it either.
The obvious first move is division: 84,000 kWh divided by the parts produced. That gives you an average which is worse than useless, because it is not stable. Produce a month of thick aluminium brackets and the figure looks excellent. Produce a month of deep-hole steel work and it looks alarming. Nothing about the shop changed. The mix changed. Any energy figure that moves when the order book moves is measuring your customers, not your factory.
So the shop does the sensible-sounding thing and gets a quote for sub-metering. The number comes back high enough to need a business case, the business case needs a saving, the saving needs a measurement — and the measurement is what you were trying to buy. That circle is where most shop-floor energy projects quietly stop, usually for two or three years, until either a customer questionnaire or an auditor restarts it under time pressure.
Meanwhile the thing worth knowing is sitting there unmeasured. On a typical machining centre, a substantial share of consumption happens when the machine is not cutting anything at all. Controls, drives held in position, hydraulics, way lubrication, chip conveyor, coolant pump, and above all the chiller — much of that runs whether or not a tool is in contact with a workpiece. A machine sitting idle overnight in a ready state can draw a meaningful fraction of what it draws while cutting. Nobody notices, because the only meter is on the building.
Why the Problem Exists Structurally
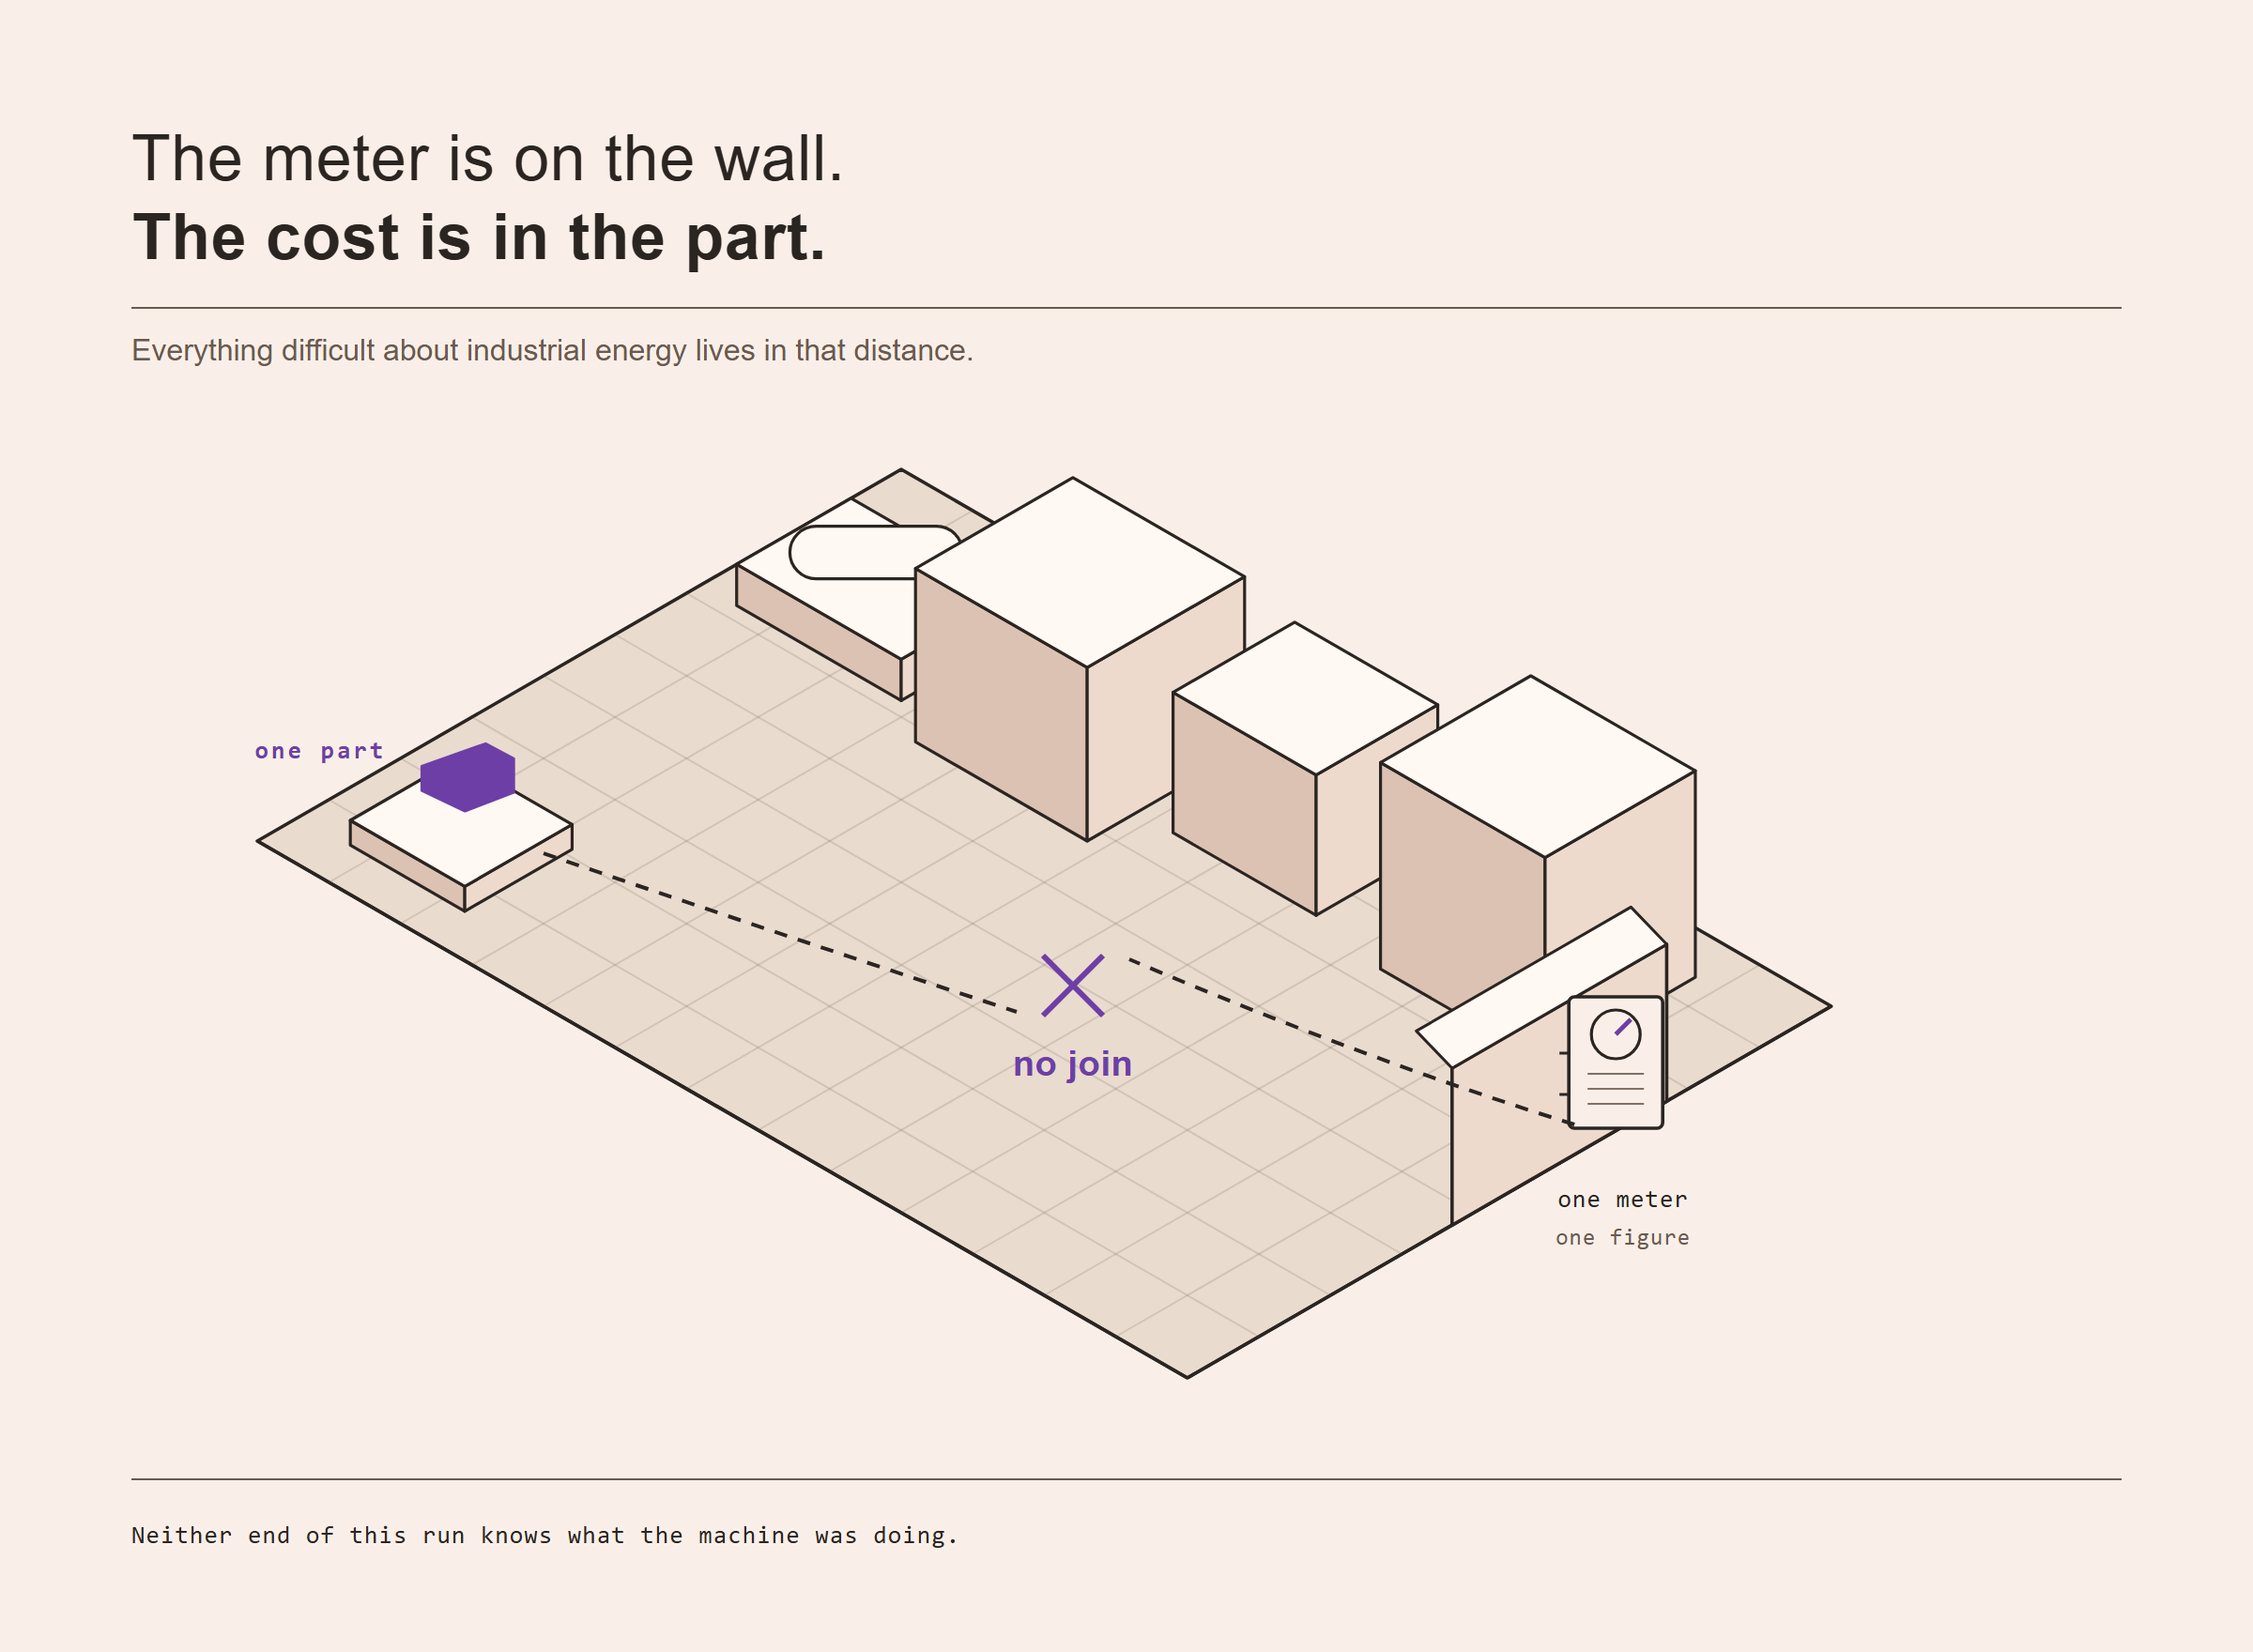
The meter is at the building. The cost is at the part. Everything painful about industrial energy management lives in the distance between those two sentences.
This is not an oversight. Electrical infrastructure was designed for a different purpose: distributing power safely and billing for it accurately. It was never designed to attribute consumption to a manufacturing operation. The main incomer is where the utility's responsibility ends and yours begins, which is exactly the wrong place to understand what anything costs to produce.
There is a second structural reason, and it is the one that connects this article to its predecessor. Energy per part is not an energy measurement. It is an energy measurement joined to a production measurement. A power reading tells you how much was drawn. It cannot tell you what was being made, or whether anything was being made at all. The join requires knowing what the machine was doing, minute by minute — which is precisely the machine-state data that most shops do not yet collect.
That has a useful consequence: a shop that has already done the work to get one honest OEE number is most of the way to energy per part. The hard part — knowing what state each machine was in, and which job was running — is shared. A shop that has not done that work will find that buying meters produces a chart of consumption over time, which looks like progress and answers no commercial question.
The third reason is that energy has historically been a fixed overhead in the mental model of most Mittelstand shops. It arrived monthly, it was what it was, and it went into the general overhead rate spread across all parts. That model held while industrial power was cheap and stable. It has not been either for several years now in Germany, and it is no longer a rounding error in a quotation.
Architecture Deep Dive
Getting to a defensible energy-per-part figure requires four decisions. As with OEE, the decisions matter more than the equipment, and getting them wrong is more expensive than measuring nothing.
Decision 1 — where you measure
There are four realistic measurement points, and they answer different questions.
The main incomer. One meter, already there, already accurate. Answers: what did the site use. Cannot answer anything about a part. Useful only as a control total to reconcile everything else against — which is a real use, so do not skip it.
The sub-panel or distribution board. One meter per area or per group of machines. Cheap relative to per-machine, and often the correct first step, because it tells you which part of the shop is worth investigating before you spend on granularity.
The machine panel. A meter on the supply to one machine. This is the level at which energy per part becomes real, because it is the level at which the join to machine state is unambiguous. It is also the level at which the argument about cost usually happens.
Drive or axis level. Spindle load, axis power, sometimes available from the control itself without any meter at all. Highest resolution, most interesting to an engineer, least likely to change a commercial decision this year. Worth knowing it exists; rarely the right place to start.
A note that saves money: you do not need the same resolution everywhere. A sensible fleet has machine-level measurement on the machines that dominate consumption or run the highest-value work, sub-panel measurement across the rest, and the incomer as the reconciliation. Uniform granularity is a symptom of a project that has not decided what question it is answering.
Decision 2 — what you attribute
Once you have a reading, you have to decide what fraction of it belongs to a part. This is where reasonable engineers reasonably differ, exactly as with OEE's planned time.
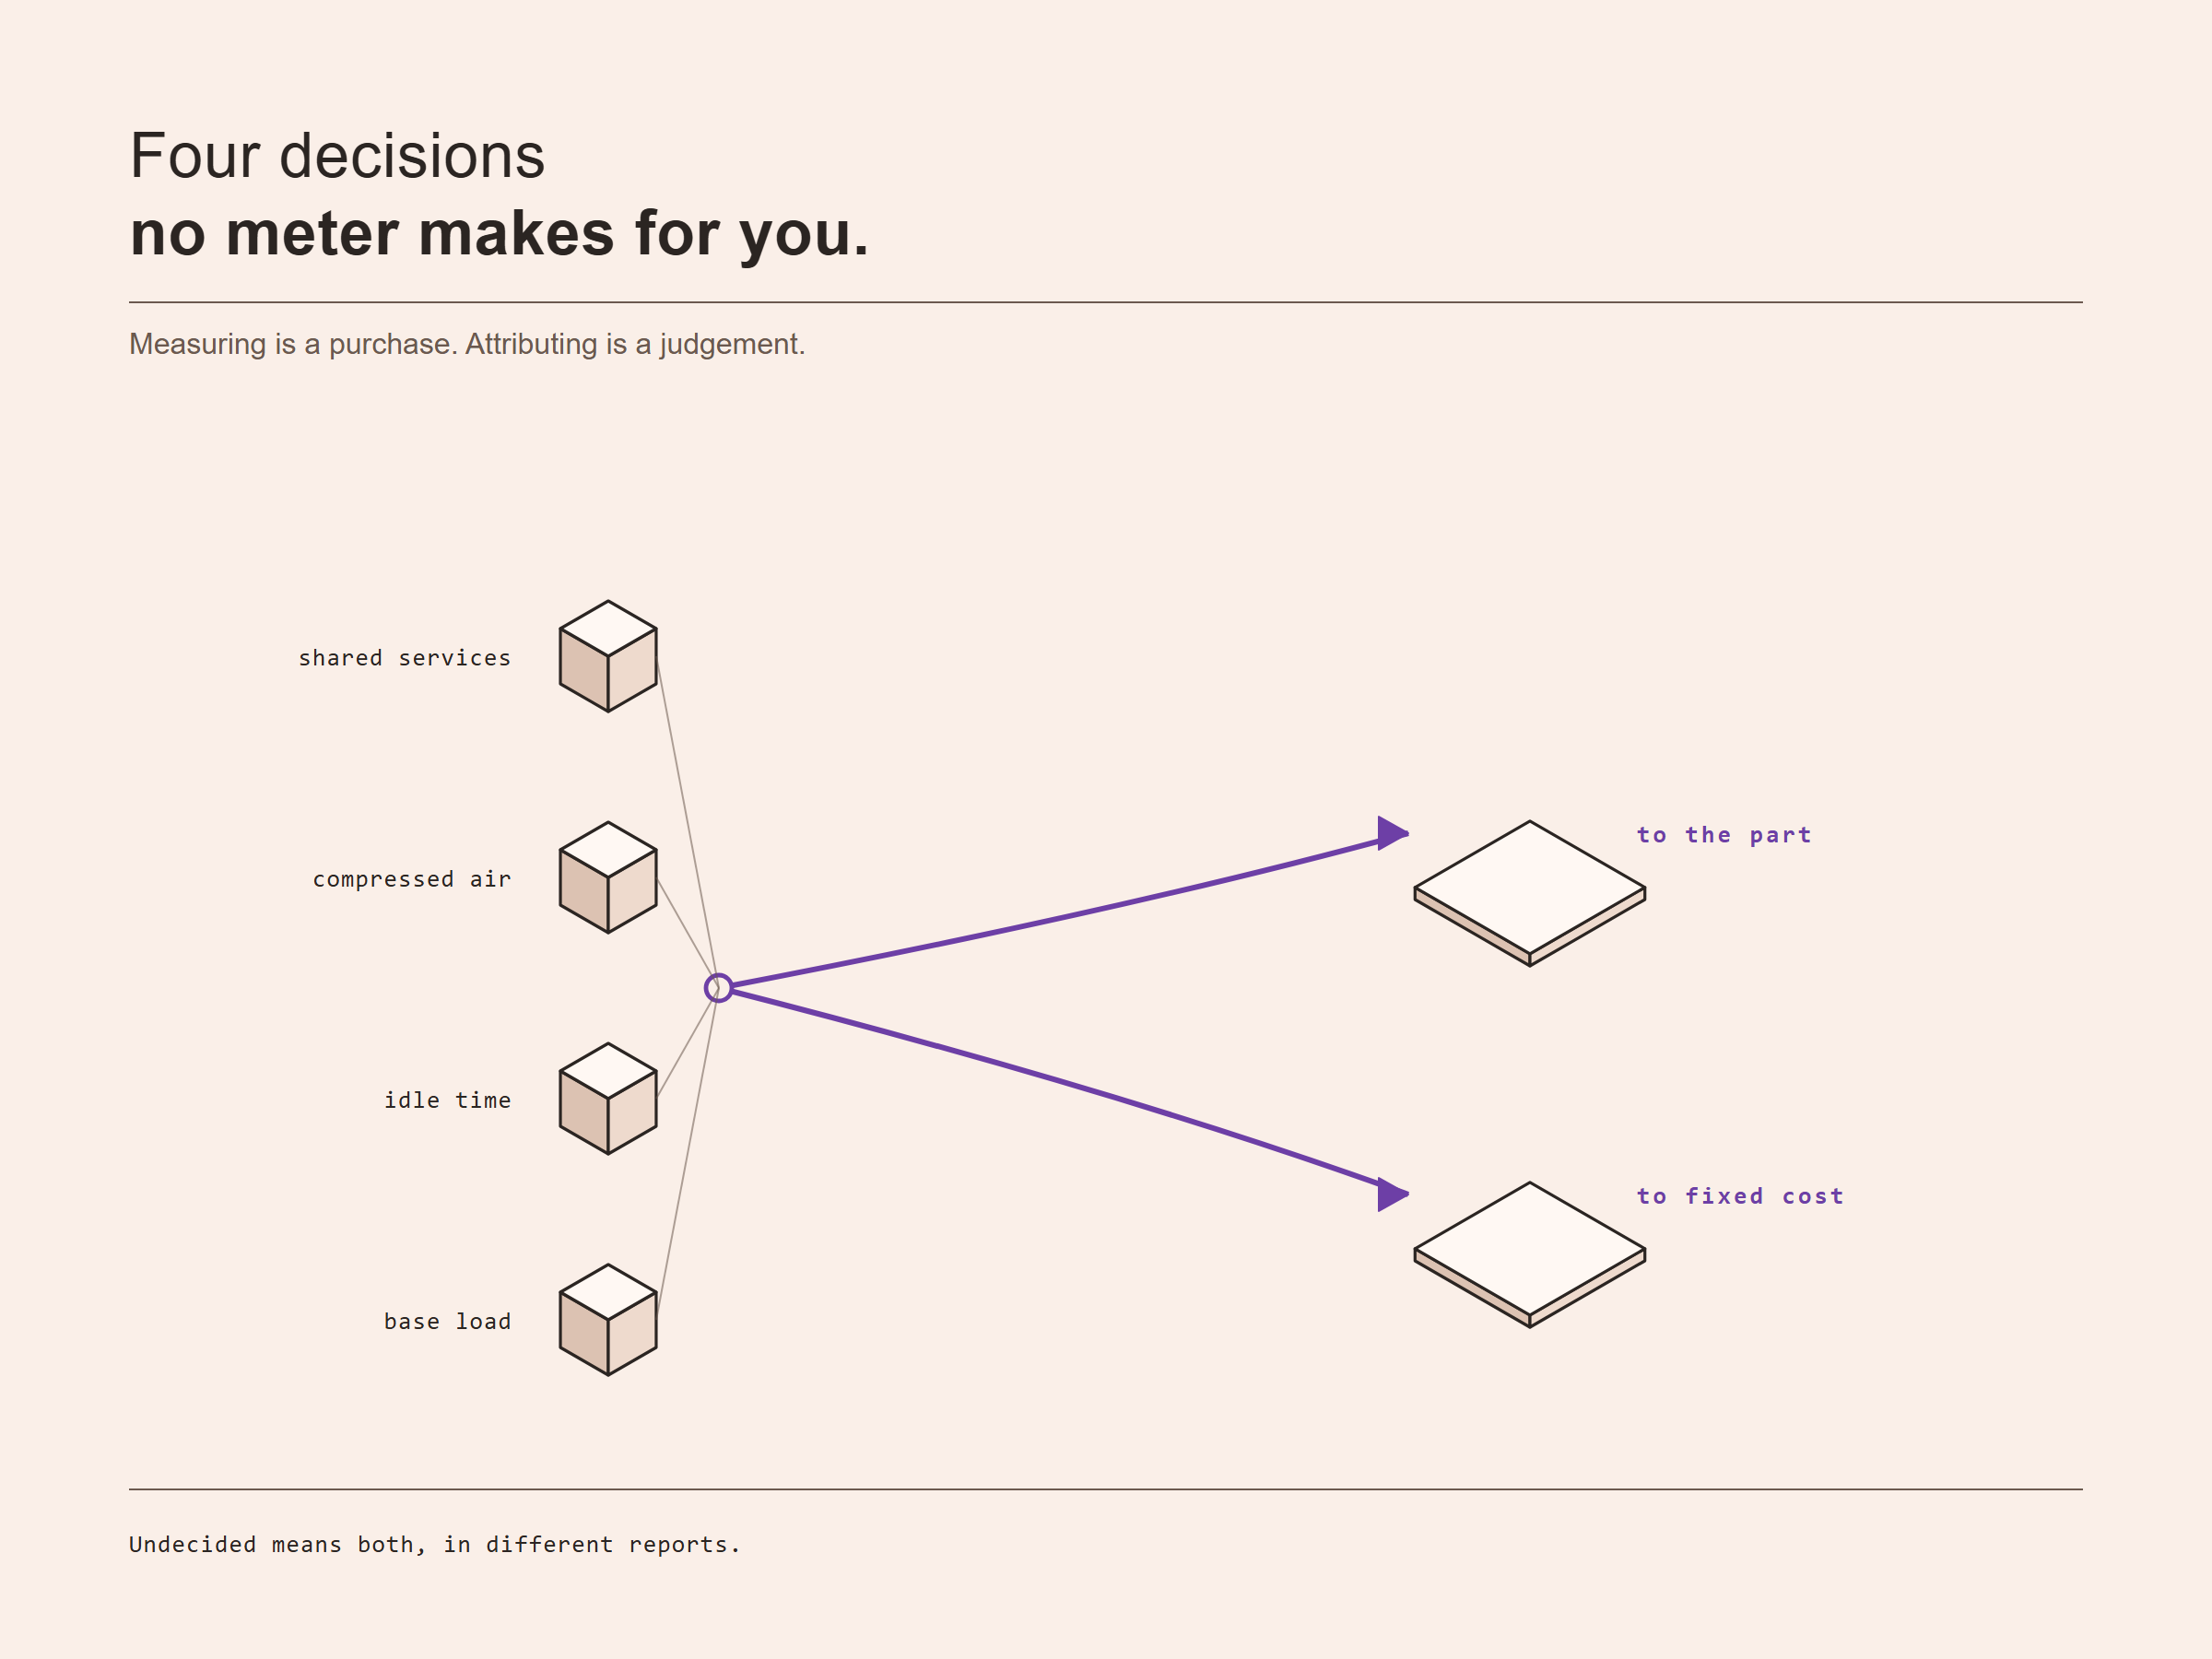
Base load versus process load. A machine consumes power to exist — controls, hydraulics, chiller, lubrication — before it removes any metal. Do you attribute that to the parts made during the shift, or treat it as a fixed cost of having the machine? Both are defensible. The first makes short runs look expensive and is arguably more honest. The second makes machine-to-machine comparison easier. Choose deliberately, write it down, and never mix the two in one report.
Idle time. A machine in a ready state overnight, making nothing, consumes real energy. Attributing that to the parts made yesterday punishes yesterday for a decision made at 18:00. Excluding it hides a cost that is often large and, unusually in manufacturing, easy to fix.
Shared services. Compressed air is the one that catches every shop out. It is generated centrally, distributed to everything, and it is expensive in electrical terms — as a rule of thumb, only a small fraction of the electricity entering a compressor arrives as useful work at the tool. Leakage in an older shop is commonly a large share of total compressed-air production, which means a meaningful share of the site's electricity bill can be leaking into the building through fittings nobody has checked. Do you attribute compressed air per machine, per area, or leave it as an overhead? Whatever you choose, measure the compressor separately, because it is frequently the largest single controllable line on the bill.
Extraction, coolant filtration, lighting and hall heating sit in the same category. Attribute them or exclude them — but do not silently include some and exclude others, which is what happens by default.
Decision 3 — how you align time
Energy data and production data arrive on different clocks and at different rates, and the join is only as good as the alignment.
A power meter might report every second, or every fifteen minutes if it is a billing-grade device. A machine might report state changes as they happen. A job record might exist only as a start and end time entered by an operator. Aligning these is not difficult, but it has to be a decision rather than an accident: what time resolution do you need, what is the source of truth for the clock, and what happens when a job boundary falls in the middle of a metering interval?
If a meter reports in fifteen-minute blocks and your typical cycle time is four minutes, you cannot attribute energy to individual parts honestly — you can attribute it to batches. That is still valuable and it is still the right answer. Claiming per-part precision you do not have is how an energy figure gets destroyed the first time a customer's engineer examines it.
Decision 4 — what the number is for
Energy per part serves at least three different purposes, and the same raw data has to be shaped differently for each.
Quoting. You want a stable, defensible figure per part family, updated periodically. Precision matters less than stability and traceability.
Operational improvement. You want to see variation — the same part costing more on Tuesday than Monday, or on one machine than another. Here precision and time resolution matter, and averages hide exactly what you need.
Reporting and customer questionnaires. You want a documented method, an auditable trail from meter to figure, and the ability to explain your boundaries. What matters here is not accuracy so much as consistency and the ability to show your working.
Trying to serve all three from one undesigned report is the most common reason energy dashboards get built, admired, and then ignored.
The pattern that works
The order is the same as it was for OEE, for the same reason.
Agree the attribution rules before buying anything. Base load, idle time, shared services, boundaries. On paper, signed by whoever will defend the number.
Measure the compressor and the incomer first. They are cheap, they are almost always informative, and the compressor frequently pays for the entire project on its own.
Join to machine state, not to a calendar. Energy against time is a chart. Energy against machine state and job is a cost.
Use one naming structure, the same one the production data already uses. Energy is another signal about the same machine, not a parallel system with its own vocabulary.
Publish the method next to the number, because this figure will eventually be read by someone outside your company.
Why Most Energy Projects Fail to Scale
Sub-metering everything, first. The most expensive way to start, and it produces granular data nobody has decided how to interpret. Consumption charts are not decisions.
No machine state, so no attribution. The single most common failure. The shop ends up able to say what a machine consumed but not what it produced while consuming it, which is a chart rather than a cost. Everything downstream — quoting, comparison, customer reporting — stays out of reach.
The compressor is never examined. Because it is not a machine tool, it belongs to nobody in particular. It is regularly the largest controllable line on the bill and the fastest payback available, and it is skipped because it is not interesting.
ISO 50001 becomes paperwork. The standard is a genuinely useful framework, and it is entirely possible to hold the certificate while every indicator you track is at site level. A site-level energy performance indicator satisfies an auditor and changes no behaviour, because nobody on the floor can influence it. The gap between having the certificate and having an actionable number is exactly the gap this article is about.
The number is built for reporting and then used for quoting. A figure with reporting-grade boundaries and monthly resolution gets pressed into a quotation, where it is wrong in a direction nobody notices until margin erodes.
Governance, Security and EU Compliance Considerations
Reporting pressure is real, and its shape is moving. European sustainability-reporting obligations and the carbon border mechanism have both been through significant scope and timing revisions, and further change is likely. The specific thresholds and dates that apply to your business, and to the customers who will pass requirements down to you, must be checked against the current legislation rather than against an article — including this one. What is stable enough to plan around is the direction: larger customers are being required to report on their value chain, and the questionnaires arrive at their suppliers regardless of whether those suppliers are themselves in scope.
For a machine shop the practical consequence arrives commercially before it arrives legally. A customer's procurement questionnaire asking for embedded energy or carbon per part is not a regulatory event, but answering it badly loses work, and answering it credibly is becoming a differentiator among Lohnfertiger who otherwise compete on price and delivery.
Materials matter more than you would expect. For a shop machining bought-in steel or aluminium, the embedded carbon of the incoming material typically dwarfs the electricity used to cut it. This is worth knowing before you spend heavily on measuring your own consumption to three decimal places: your energy figure is a small part of the product footprint your customer is asking about. It is still the part you control.
The works council. Energy data is a materially easier conversation than machine-state monitoring, and this is genuinely one of its advantages — a meter on a distribution panel observes a circuit, not a person. But the rail is unchanged: the unit of analysis is the machine, energy data does not become a route to comparing individuals across shifts, and the data model gets shown to the Betriebsrat early rather than explained afterwards. A shop that has already had the machine-state conversation will find this one short.
Security posture. Energy metering usually means adding devices to a network, often by an electrical contractor rather than an IT function. Decide before installation which network those devices sit on, whether they can be reached from outside, and who is responsible for their firmware. A cheap meter with a web interface and a default password is a genuine exposure, and it will be installed by someone who was not asked about security because they were asked about electricity.
Decision Framework for Platform Evaluation
- Can it join energy to machine state and job, or only to time? If only to time, it is a monitoring tool, not a costing tool. This single question separates most options.
- Whose attribution rules? Base load, idle, shared services — can you set these yourself, and change them later without a services engagement?
- Does it accept the meters you can actually buy locally, over standard protocols, or does it require a specific product line? Meter lock-in is the same trap as control lock-in, at a smaller scale.
- Can you show the method to a customer's auditor? From meter reading to published figure, traceably.
- Does it share the naming structure with your production data, or is it a second system with a second vocabulary and a second integration to maintain?
Executive Summary — Board-Level Interpretation
One. The shop currently prices energy as a general overhead spread evenly across all work. While power was cheap that was a reasonable approximation. It is now a source of quoting error that runs in an unknown direction, part by part.
Two. The route to a per-part figure runs through production data, not through meters. Meters are the smaller cost; knowing what each machine was doing is the substantive work, and it is the same work that yields a trustworthy OEE number. Fund them as one programme and they cost meaningfully less than two.
Three. Two returns, on different horizons. Immediately: base load, idle consumption and compressed-air losses are usually the largest controllable costs on the bill, and they are visible within weeks of the first measurements. Over the next few years: customers will increasingly require a defensible per-part figure, and a shop that can produce one with its method attached will win work from shops that cannot.
The failure mode to guard against at board level is funding meters without funding the production-data join. That reliably produces an expensive chart.
Practical Implementation Checklist
Before buying any hardware
- Pull twelve months of bills. Establish the site total, the seasonal shape, and the tariff structure — peak pricing changes which improvements pay.
- Walk the shop out of hours, when nothing is producing. Note what is running. This costs one evening and routinely finds the largest single saving in the project.
- Agree the attribution rules: base load, idle time, compressed air, extraction, lighting, heating. In or out, and written down.
- Decide what the number is for — quoting, improvement, or reporting — and accept that the first version serves one of the three well.
First measurements
- Meter the compressor separately. Do this first.
- Meter the incomer as the reconciliation total.
- Sub-meter by area before per-machine, unless one machine obviously dominates.
- Conduct a compressed-air leak survey during a shutdown, with the system pressurised and everything else off. The result is usually uncomfortable and immediately actionable.
Before the number is trusted
- Reconcile: measured points plus estimated remainder should approximate the incomer. If they do not, resolve it before publishing anything.
- Test the figure against two contrasting part families. If it does not distinguish them, the attribution rules are wrong.
- Write the method down as if a customer's auditor will read it, because eventually one will.

A note on where we stand
We build software in exactly this space, so we are not a neutral party and it would be silly to pretend otherwise. What this article deliberately does not do is describe what our software does. The product is under active development as this is written, and a capability sentence written this month would be a description of last month's product, published under a real company's name. We would rather say nothing than say something that is checkable and wrong by the time you read it.
So judge any supplier, including us, on the five questions above and on nothing else. One of them is worth repeating, because it is the one the industry is least honest about: nobody sells you the metering. Specifying and installing current transformers on a live panel is an electrical contractor's work, under your local rules, with your own electrician signing it off. A platform that folds the hardware into its own offer is selling you a bundle, and the part of that bundle you will still be paying for in five years is not the meter.
The uncomfortable truth underneath this whole article is that the meters are the cheap part and the late part. Whatever you buy, the expensive question stays the same: do you know what each machine was doing at the moment the power was drawn? That is a production-data question, and no amount of metering answers it.
If you want to sanity-check your own position before talking to anyone, we publish a free self-assessment at criussoftware.com/res/kits/readiness/. It asks for a work email and returns a scored result. It is a self-check, not an audit, and it will tell you honestly if the answer is that you are not ready to measure anything yet.
Questions worth asking in your next review
- If a customer asked today for the energy consumed producing one of your parts, what would you send them — and how long would it take to produce?
- What did your shop draw last night, with nothing in production? Has anyone measured it, or is it an assumption?
- Is your compressor separately metered, and when was the last leak survey conducted with the line pressurised?
- When your energy figure moves month to month, can you tell whether the shop changed or the product mix changed?
- Are base load and idle consumption attributed to parts, treated as fixed cost, or has nobody decided — meaning both happen in different reports?
- If you hold ISO 50001, is any indicator you track at a level someone on the floor can actually influence?
- Could you show a customer's auditor the path from a meter reading to a published per-part figure, without rebuilding it first?
The part that matters
Energy per part looks like a metering question and is a production-data question wearing a metering costume.
The shops that will answer their customers' questionnaires credibly over the next few years are not the ones that installed the most meters. They are the ones that already knew what each machine was doing, minute by minute, and could therefore join a power reading to a job without inventing anything. The meters are the cheap part and the late part.
Which means the honest first step, for most shops, is not a metering quotation. It is an evening walking the shop with everything switched off that should be, and a decision — written down, before anything is bought — about what a kilowatt-hour belongs to.
One number, one method, defensible to someone outside your company. That is what the questionnaire is really asking for.
Spend one evening walking the shop with a clamp meter while nothing is in production. It costs an evening, needs no business case, and it is the one measurement that tells you whether you have an energy problem or an attribution problem.
Read next
- One Cockpit, Not Four Portals — the companion piece: the same shop, the same machine-state foundation, a different number.
- Why Your Dashboard Did Not Change Anything — what happens when a figure arrives and nobody can act on it.
- Exploring IoT Sensor Types — what a meter actually is, alongside every other signal you might add.
- Your Oldest Machine Is the Easy One — the machine with no interface is a permission problem, not an age problem.
Full blog text — board-ready report format
Total Site kWh Tells You Nothing: Getting to Energy Per Part on a CNC Fleet
Your energy bill arrives once a month with one number on it. Your customers are starting to ask what a part costs to make, in kilowatt-hours and increasingly in kilograms of CO2. Those two facts are separated by roughly four decisions, and none of them is about buying meters.
This is the companion piece to our article on getting a single OEE number out of a mixed CNC fleet. It is the same shop, the same machines and the same underlying discipline — applied to a different number, and one that has become considerably harder to avoid.
Industrial Reality Check
The bill says the site used 84,000 kWh last month. Nobody disputes it. Nobody can act on it either.
The obvious first move is division: 84,000 kWh divided by the parts produced. That gives you an average which is worse than useless, because it is not stable. Produce a month of thick aluminium brackets and the figure looks excellent. Produce a month of deep-hole steel work and it looks alarming. Nothing about the shop changed. The mix changed. Any energy figure that moves when the order book moves is measuring your customers, not your factory.
So the shop does the sensible-sounding thing and gets a quote for sub-metering. The number comes back high enough to need a business case, the business case needs a saving, the saving needs a measurement — and the measurement is what you were trying to buy. That circle is where most shop-floor energy projects quietly stop, usually for two or three years, until either a customer questionnaire or an auditor restarts it under time pressure.
Meanwhile the thing worth knowing is sitting there unmeasured. On a typical machining centre, a substantial share of consumption happens when the machine is not cutting anything at all. Controls, drives held in position, hydraulics, way lubrication, chip conveyor, coolant pump, and above all the chiller — much of that runs whether or not a tool is in contact with a workpiece. A machine sitting idle overnight in a ready state can draw a meaningful fraction of what it draws while cutting. Nobody notices, because the only meter is on the building.
Why the Problem Exists Structurally
The meter is at the building. The cost is at the part. Everything painful about industrial energy management lives in the distance between those two sentences.
This is not an oversight. Electrical infrastructure was designed for a different purpose: distributing power safely and billing for it accurately. It was never designed to attribute consumption to a manufacturing operation. The main incomer is where the utility's responsibility ends and yours begins, which is exactly the wrong place to understand what anything costs to produce.
There is a second structural reason, and it is the one that connects this article to its predecessor. Energy per part is not an energy measurement. It is an energy measurement joined to a production measurement. A power reading tells you how much was drawn. It cannot tell you what was being made, or whether anything was being made at all. The join requires knowing what the machine was doing, minute by minute — which is precisely the machine-state data that most shops do not yet collect.
That has a useful consequence: a shop that has already done the work to get one honest OEE number is most of the way to energy per part. The hard part — knowing what state each machine was in, and which job was running — is shared. A shop that has not done that work will find that buying meters produces a chart of consumption over time, which looks like progress and answers no commercial question.
The third reason is that energy has historically been a fixed overhead in the mental model of most Mittelstand shops. It arrived monthly, it was what it was, and it went into the general overhead rate spread across all parts. That model held while industrial power was cheap and stable. It has not been either for several years now in Germany, and it is no longer a rounding error in a quotation.
Architecture Deep Dive
Getting to a defensible energy-per-part figure requires four decisions. As with OEE, the decisions matter more than the equipment, and getting them wrong is more expensive than measuring nothing.
Decision 1 — where you measure
There are four realistic measurement points, and they answer different questions.
The main incomer. One meter, already there, already accurate. Answers: what did the site use. Cannot answer anything about a part. Useful only as a control total to reconcile everything else against — which is a real use, so do not skip it.
The sub-panel or distribution board. One meter per area or per group of machines. Cheap relative to per-machine, and often the correct first step, because it tells you which part of the shop is worth investigating before you spend on granularity.
The machine panel. A meter on the supply to one machine. This is the level at which energy per part becomes real, because it is the level at which the join to machine state is unambiguous. It is also the level at which the argument about cost usually happens.
Drive or axis level. Spindle load, axis power, sometimes available from the control itself without any meter at all. Highest resolution, most interesting to an engineer, least likely to change a commercial decision this year. Worth knowing it exists; rarely the right place to start.
A note that saves money: you do not need the same resolution everywhere. A sensible fleet has machine-level measurement on the machines that dominate consumption or run the highest-value work, sub-panel measurement across the rest, and the incomer as the reconciliation. Uniform granularity is a symptom of a project that has not decided what question it is answering.
Decision 2 — what you attribute
Once you have a reading, you have to decide what fraction of it belongs to a part. This is where reasonable engineers reasonably differ, exactly as with OEE's planned time.
Base load versus process load. A machine consumes power to exist — controls, hydraulics, chiller, lubrication — before it removes any metal. Do you attribute that to the parts made during the shift, or treat it as a fixed cost of having the machine? Both are defensible. The first makes short runs look expensive and is arguably more honest. The second makes machine-to-machine comparison easier. Choose deliberately, write it down, and never mix the two in one report.
Idle time. A machine in a ready state overnight, making nothing, consumes real energy. Attributing that to the parts made yesterday punishes yesterday for a decision made at 18:00. Excluding it hides a cost that is often large and, unusually in manufacturing, easy to fix.
Shared services. Compressed air is the one that catches every shop out. It is generated centrally, distributed to everything, and it is expensive in electrical terms — as a rule of thumb, only a small fraction of the electricity entering a compressor arrives as useful work at the tool. Leakage in an older shop is commonly a large share of total compressed-air production, which means a meaningful share of the site's electricity bill can be leaking into the building through fittings nobody has checked. Do you attribute compressed air per machine, per area, or leave it as an overhead? Whatever you choose, measure the compressor separately, because it is frequently the largest single controllable line on the bill.
Extraction, coolant filtration, lighting and hall heating sit in the same category. Attribute them or exclude them — but do not silently include some and exclude others, which is what happens by default.
Decision 3 — how you align time
Energy data and production data arrive on different clocks and at different rates, and the join is only as good as the alignment.
A power meter might report every second, or every fifteen minutes if it is a billing-grade device. A machine might report state changes as they happen. A job record might exist only as a start and end time entered by an operator. Aligning these is not difficult, but it has to be a decision rather than an accident: what time resolution do you need, what is the source of truth for the clock, and what happens when a job boundary falls in the middle of a metering interval?
If a meter reports in fifteen-minute blocks and your typical cycle time is four minutes, you cannot attribute energy to individual parts honestly — you can attribute it to batches. That is still valuable and it is still the right answer. Claiming per-part precision you do not have is how an energy figure gets destroyed the first time a customer's engineer examines it.
Decision 4 — what the number is for
Energy per part serves at least three different purposes, and the same raw data has to be shaped differently for each.
Quoting. You want a stable, defensible figure per part family, updated periodically. Precision matters less than stability and traceability.
Operational improvement. You want to see variation — the same part costing more on Tuesday than Monday, or on one machine than another. Here precision and time resolution matter, and averages hide exactly what you need.
Reporting and customer questionnaires. You want a documented method, an auditable trail from meter to figure, and the ability to explain your boundaries. What matters here is not accuracy so much as consistency and the ability to show your working.
Trying to serve all three from one undesigned report is the most common reason energy dashboards get built, admired, and then ignored.
The pattern that works
The order is the same as it was for OEE, for the same reason.
Agree the attribution rules before buying anything. Base load, idle time, shared services, boundaries. On paper, signed by whoever will defend the number.
Measure the compressor and the incomer first. They are cheap, they are almost always informative, and the compressor frequently pays for the entire project on its own.
Join to machine state, not to a calendar. Energy against time is a chart. Energy against machine state and job is a cost.
Use one naming structure, the same one the production data already uses. Energy is another signal about the same machine, not a parallel system with its own vocabulary.
Publish the method next to the number, because this figure will eventually be read by someone outside your company.
Why Most Energy Projects Fail to Scale
Sub-metering everything, first. The most expensive way to start, and it produces granular data nobody has decided how to interpret. Consumption charts are not decisions.
No machine state, so no attribution. The single most common failure. The shop ends up able to say what a machine consumed but not what it produced while consuming it, which is a chart rather than a cost. Everything downstream — quoting, comparison, customer reporting — stays out of reach.
The compressor is never examined. Because it is not a machine tool, it belongs to nobody in particular. It is regularly the largest controllable line on the bill and the fastest payback available, and it is skipped because it is not interesting.
ISO 50001 becomes paperwork. The standard is a genuinely useful framework, and it is entirely possible to hold the certificate while every indicator you track is at site level. A site-level energy performance indicator satisfies an auditor and changes no behaviour, because nobody on the floor can influence it. The gap between having the certificate and having an actionable number is exactly the gap this article is about.
The number is built for reporting and then used for quoting. A figure with reporting-grade boundaries and monthly resolution gets pressed into a quotation, where it is wrong in a direction nobody notices until margin erodes.
Governance, Security and EU Compliance Considerations
Reporting pressure is real, and its shape is moving. European sustainability-reporting obligations and the carbon border mechanism have both been through significant scope and timing revisions, and further change is likely. The specific thresholds and dates that apply to your business, and to the customers who will pass requirements down to you, must be checked against the current legislation rather than against an article — including this one. What is stable enough to plan around is the direction: larger customers are being required to report on their value chain, and the questionnaires arrive at their suppliers regardless of whether those suppliers are themselves in scope.
For a machine shop the practical consequence arrives commercially before it arrives legally. A customer's procurement questionnaire asking for embedded energy or carbon per part is not a regulatory event, but answering it badly loses work, and answering it credibly is becoming a differentiator among Lohnfertiger who otherwise compete on price and delivery.
Materials matter more than you would expect. For a shop machining bought-in steel or aluminium, the embedded carbon of the incoming material typically dwarfs the electricity used to cut it. This is worth knowing before you spend heavily on measuring your own consumption to three decimal places: your energy figure is a small part of the product footprint your customer is asking about. It is still the part you control.
The works council. Energy data is a materially easier conversation than machine-state monitoring, and this is genuinely one of its advantages — a meter on a distribution panel observes a circuit, not a person. But the rail is unchanged: the unit of analysis is the machine, energy data does not become a route to comparing individuals across shifts, and the data model gets shown to the Betriebsrat early rather than explained afterwards. A shop that has already had the machine-state conversation will find this one short.
Security posture. Energy metering usually means adding devices to a network, often by an electrical contractor rather than an IT function. Decide before installation which network those devices sit on, whether they can be reached from outside, and who is responsible for their firmware. A cheap meter with a web interface and a default password is a genuine exposure, and it will be installed by someone who was not asked about security because they were asked about electricity.
Decision Framework for Platform Evaluation
- Can it join energy to machine state and job, or only to time? If only to time, it is a monitoring tool, not a costing tool. This single question separates most options.
- Whose attribution rules? Base load, idle, shared services — can you set these yourself, and change them later without a services engagement?
- Does it accept the meters you can actually buy locally, over standard protocols, or does it require a specific product line? Meter lock-in is the same trap as control lock-in, at a smaller scale.
- Can you show the method to a customer's auditor? From meter reading to published figure, traceably.
- Does it share the naming structure with your production data, or is it a second system with a second vocabulary and a second integration to maintain?
Executive Summary — Board-Level Interpretation
One. The shop currently prices energy as a general overhead spread evenly across all work. While power was cheap that was a reasonable approximation. It is now a source of quoting error that runs in an unknown direction, part by part.
Two. The route to a per-part figure runs through production data, not through meters. Meters are the smaller cost; knowing what each machine was doing is the substantive work, and it is the same work that yields a trustworthy OEE number. Fund them as one programme and they cost meaningfully less than two.
Three. Two returns, on different horizons. Immediately: base load, idle consumption and compressed-air losses are usually the largest controllable costs on the bill, and they are visible within weeks of the first measurements. Over the next few years: customers will increasingly require a defensible per-part figure, and a shop that can produce one with its method attached will win work from shops that cannot.
The failure mode to guard against at board level is funding meters without funding the production-data join. That reliably produces an expensive chart.
Practical Implementation Checklist
Before buying any hardware
- Pull twelve months of bills. Establish the site total, the seasonal shape, and the tariff structure — peak pricing changes which improvements pay.
- Walk the shop out of hours, when nothing is producing. Note what is running. This costs one evening and routinely finds the largest single saving in the project.
- Agree the attribution rules: base load, idle time, compressed air, extraction, lighting, heating. In or out, and written down.
- Decide what the number is for — quoting, improvement, or reporting — and accept that the first version serves one of the three well.
First measurements
- Meter the compressor separately. Do this first.
- Meter the incomer as the reconciliation total.
- Sub-meter by area before per-machine, unless one machine obviously dominates.
- Conduct a compressed-air leak survey during a shutdown, with the system pressurised and everything else off. The result is usually uncomfortable and immediately actionable.
Before the number is trusted
- Reconcile: measured points plus estimated remainder should approximate the incomer. If they do not, resolve it before publishing anything.
- Test the figure against two contrasting part families. If it does not distinguish them, the attribution rules are wrong.
- Write the method down as if a customer's auditor will read it, because eventually one will.
A note on where we stand
We build software in exactly this space, so we are not a neutral party and it would be silly to pretend otherwise. What this article deliberately does not do is describe what our software does. The product is under active development as this is written, and a capability sentence written this month would be a description of last month's product, published under a real company's name. We would rather say nothing than say something that is checkable and wrong by the time you read it.
So judge any supplier, including us, on the five questions above and on nothing else. One of them is worth repeating, because it is the one the industry is least honest about: nobody sells you the metering. Specifying and installing current transformers on a live panel is an electrical contractor's work, under your local rules, with your own electrician signing it off. A platform that folds the hardware into its own offer is selling you a bundle, and the part of that bundle you will still be paying for in five years is not the meter.
The uncomfortable truth underneath this whole article is that the meters are the cheap part and the late part. Whatever you buy, the expensive question stays the same: do you know what each machine was doing at the moment the power was drawn? That is a production-data question, and no amount of metering answers it.
If you want to sanity-check your own position before talking to anyone, we publish a free self-assessment at criussoftware.com/res/kits/readiness/. It asks for a work email and returns a scored result. It is a self-check, not an audit, and it will tell you honestly if the answer is that you are not ready to measure anything yet.
Questions worth asking in your next review
- If a customer asked today for the energy consumed producing one of your parts, what would you send them — and how long would it take to produce?
- What did your shop draw last night, with nothing in production? Has anyone measured it, or is it an assumption?
- Is your compressor separately metered, and when was the last leak survey conducted with the line pressurised?
- When your energy figure moves month to month, can you tell whether the shop changed or the product mix changed?
- Are base load and idle consumption attributed to parts, treated as fixed cost, or has nobody decided — meaning both happen in different reports?
- If you hold ISO 50001, is any indicator you track at a level someone on the floor can actually influence?
- Could you show a customer's auditor the path from a meter reading to a published per-part figure, without rebuilding it first?
The part that matters
Energy per part looks like a metering question and is a production-data question wearing a metering costume.
The shops that will answer their customers' questionnaires credibly over the next few years are not the ones that installed the most meters. They are the ones that already knew what each machine was doing, minute by minute, and could therefore join a power reading to a job without inventing anything. The meters are the cheap part and the late part.
Which means the honest first step, for most shops, is not a metering quotation. It is an evening walking the shop with everything switched off that should be, and a decision — written down, before anything is bought — about what a kilowatt-hour belongs to.
One number, one method, defensible to someone outside your company. That is what the questionnaire is really asking for.
No comments yet. Be the first to comment.