

The Morning Meeting Still Runs on a Spreadsheet: Why Your Dashboard Did Not Change Anything
There is a particular silence in a production meeting that happens about four minutes in.
The plant manager has the overview screen on the wall. Availability, performance, quality, a trend line, a set of coloured tiles. Someone asks why Tuesday afternoon fell over. The screen shows that Tuesday afternoon fell over. It does not show why, and it does not show what anyone did about it. So a supervisor opens a laptop, and on the laptop is a spreadsheet, and in the spreadsheet is the answer — typed in by hand, the previous evening, by someone who stayed late.
That plant is digitalised. It has the screens to prove it. It also has a spreadsheet at the centre of its decision-making, and nobody in the room finds this strange any more.
This is the most common outcome of an industrial digitalisation project, and it is not a failure of execution. The screens work. The data is accurate. The vendor delivered what was specified. The problem is that what was specified was visibility, and what was needed was a decision.
Listen — audio overview
Watch — video overview
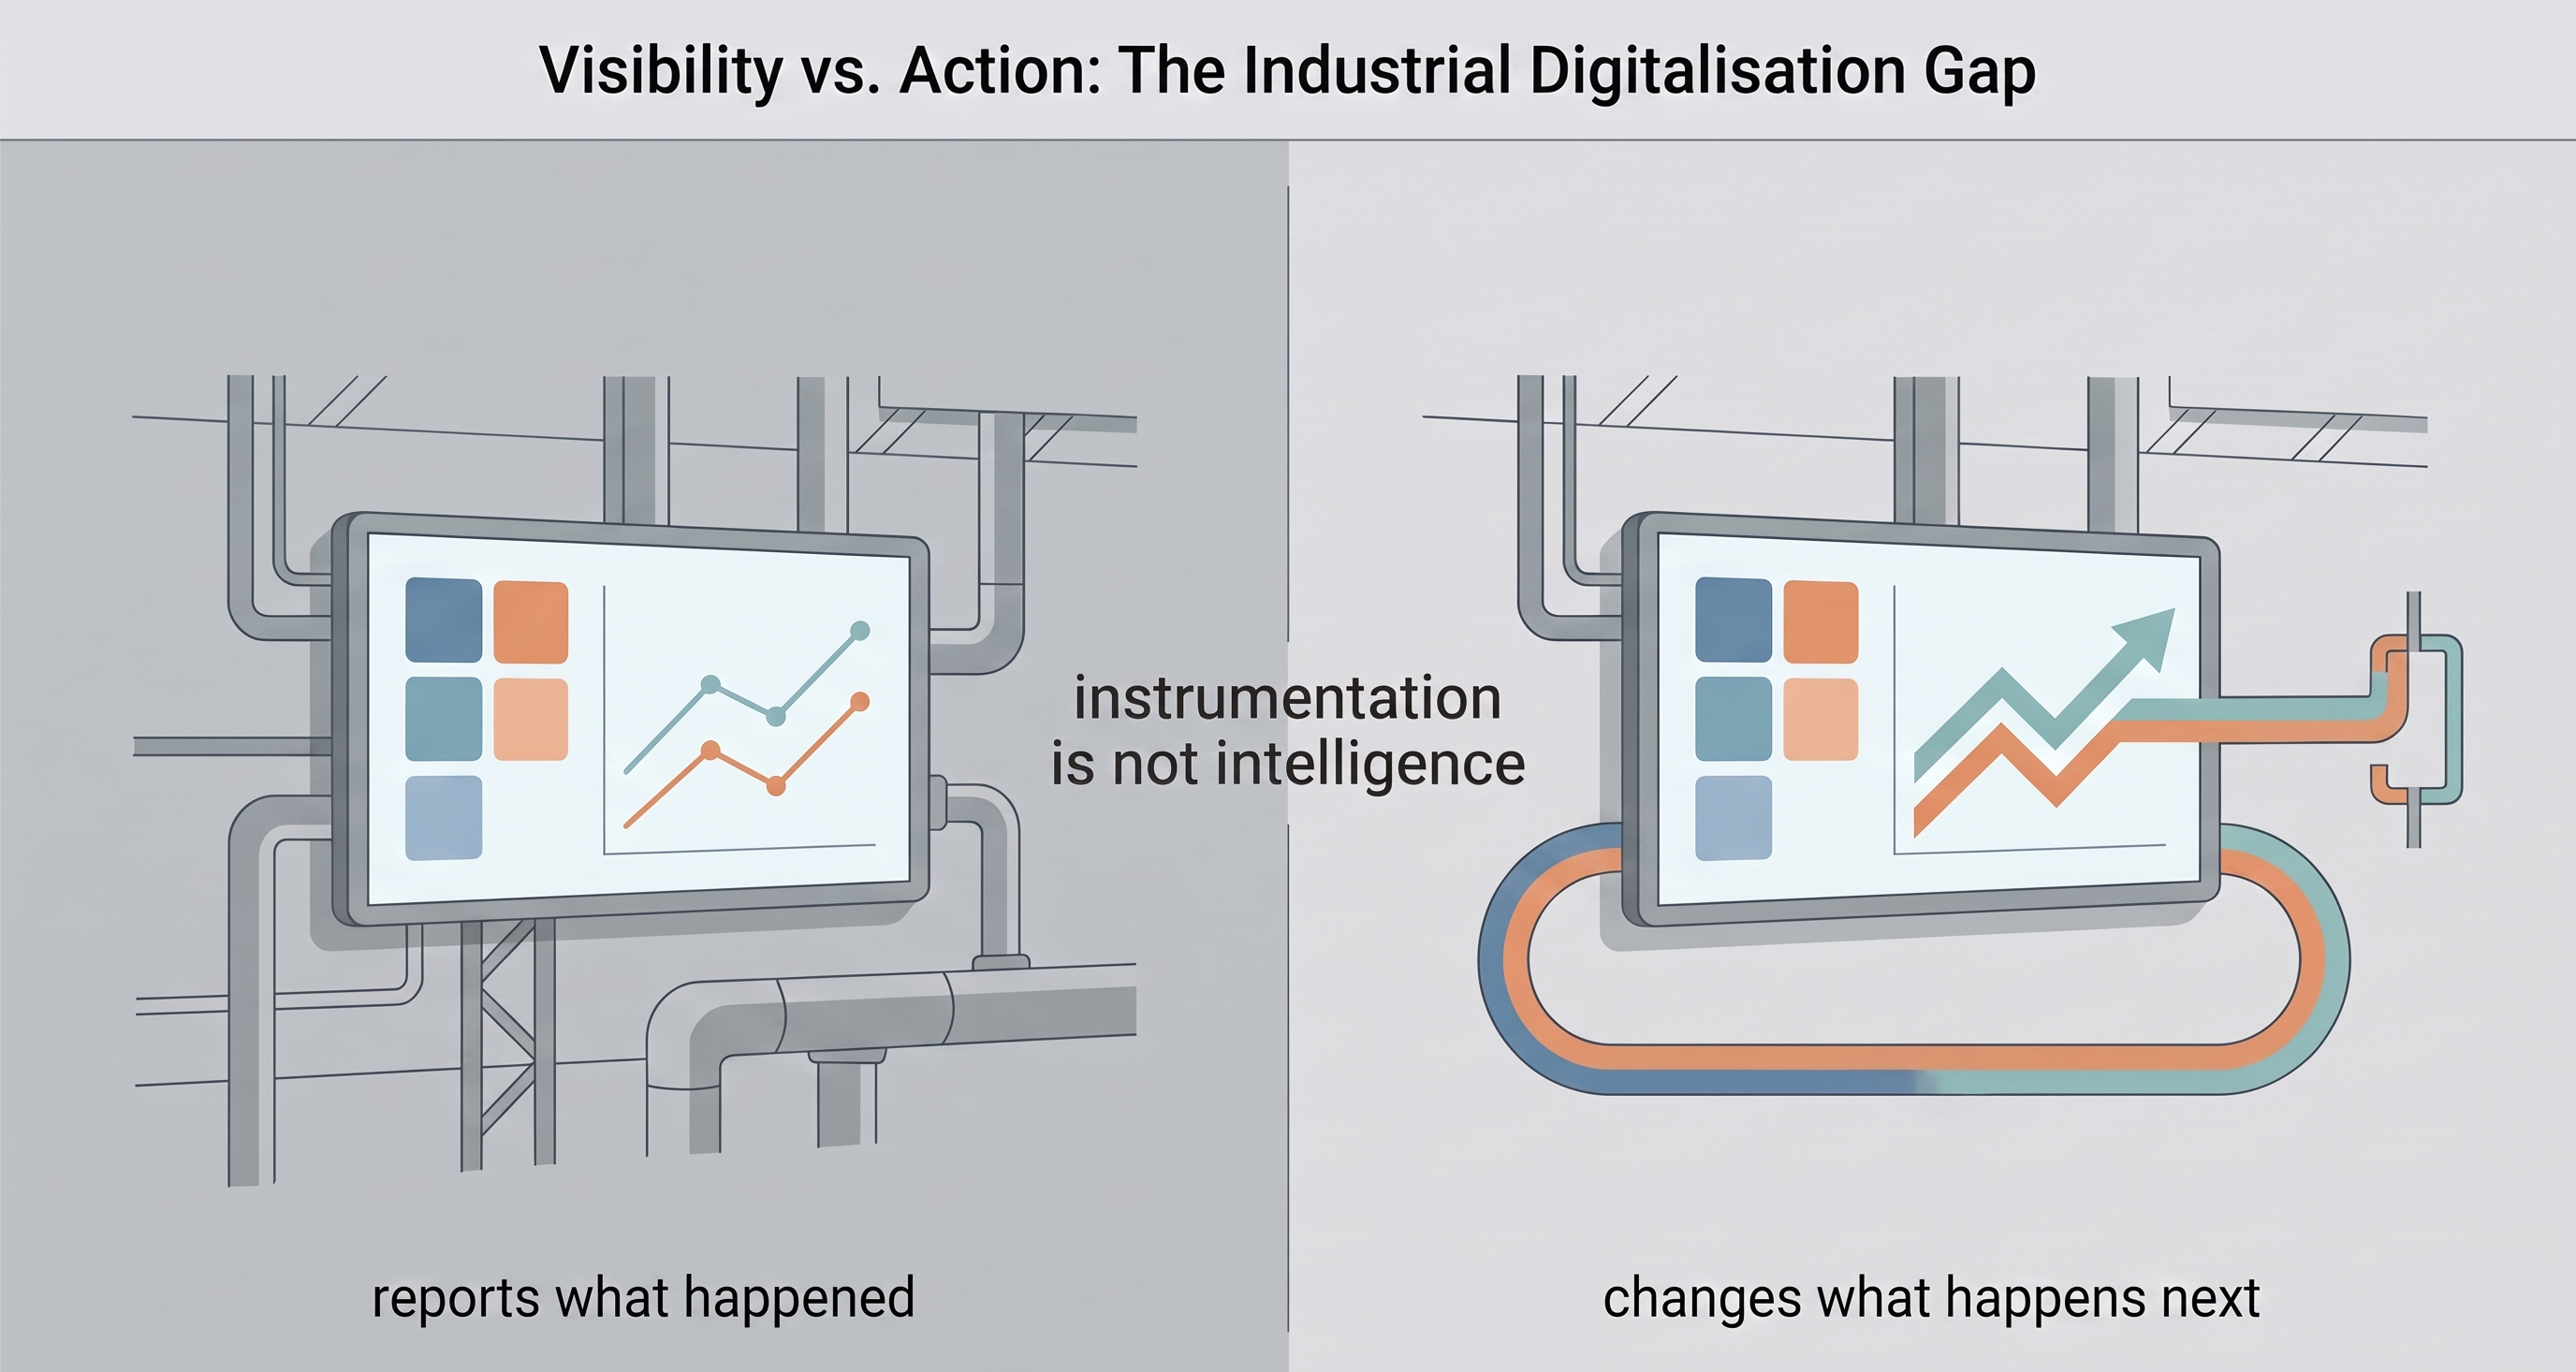
Instrumentation is not intelligence
Here is the sentence worth taking away, because it is the diagnostic:
If your system needs a person to interpret every anomaly before anything happens, it is not intelligent. It is expensive monitoring.
A dashboard is a reporting artifact. It tells you what happened. It does not decide, it does not act, and it does not close a loop. Those are different capabilities with different costs, and the industry has spent a decade selling the first as though it were all three.
This matters because of what gets budgeted. A plant approves a project called "OEE visibility", gets OEE visibility, and then discovers that the gap between seeing a number and changing the number was never in scope. There is no line item for it. There is no owner for it. There is, eventually, a spreadsheet for it.
Three structural claims carry the rest of this article. None of them is about technology being immature. All of them are about a category error in what was bought.
Claim one: visibility was the cheap half
Getting a signal from a machine onto a screen is, in 2026, a solved problem.
That was not true fifteen years ago and it is worth being precise about why it changed. A modern control that speaks a standard information model over OPC UA — umati being the one the German machine tool sector has actually converged on — exposes its state in a form that does not need reverse engineering. Older controls give up register access over Modbus TCP. Machining centres frequently speak MTConnect. Below that there are potential-free contacts, a stack light, a signal you can read with a clamp. And below that there are machines that emit nothing at all and need a sensor added.
Every one of those bands is a known engineering problem with a known cost. There are integrators in every industrial region who do this work competently. The hard part of connectivity is commercial and organisational — warranty terms, network segmentation obligations, who is allowed to touch a control during a production week — not technical.
So when a plant celebrates having connected sixty machines, it has completed the part of the journey that money reliably buys. The tiles light up. The trend lines populate. It feels like the hard part because it took eighteen months, and it took eighteen months for reasons that had almost nothing to do with the difficulty of reading a register.
The part that money does not reliably buy comes next: deciding what to do about what the tiles say, automatically and repeatably, without a person in the middle of every instance.
That second half has no natural completion ceremony. Nobody holds a go-live for it. It tends not to get a budget of its own, because the first project was called "digitalisation" and it is finished.
Claim two: a dashboard moves the work, it does not remove it
Before the dashboard, a problem on line three was discovered when someone noticed it.
After the dashboard, a problem on line three is displayed. Someone still has to look, interpret, judge whether it matters, decide what to do, and then do it. The plant has not removed a decision. It has added a monitoring task — and it has usually added that task to a person who already had a job.
This is the quiet arithmetic that goes unexamined. A screen that surfaces forty anomalies a shift, of which three matter, has created a triage burden. If nobody is given the time to triage, one of two things happens. Either the screen is watched during the day shift and ignored at night, or it stops being watched at all and becomes wall furniture — present, expensive, and consulted only after something has already gone wrong, to confirm that it went wrong.
Both outcomes are extremely common and neither shows up in any project review, because the project was delivered.
Ask the question directly and the answer is usually uncomfortable: when the dashboard shows an anomaly at 03:00 on a Sunday, what happens next, and who does it? In most plants the honest answer is "nothing, until Monday". Which means the value of detecting it on Sunday was zero. The detection was real. The outcome was not.
There is a version of this that is worse. A plant that has invested in visibility often develops a reporting culture around it — a morning review of yesterday's tiles, a weekly deck, a monthly trend. The screens generate meetings. Meetings feel like management. And the underlying loop — signal, decision, action, verification — is still being closed by hand, by the same people, at the same speed as before, with better graphics.
Claim three: dashboards multiply, and then they disagree
This is the failure mode that does the most damage, and it is structural rather than accidental.
Every system ships its own dashboard. The machine tool vendor's portal has one. The energy monitoring system has one. The MES has one. The retrofit sensor kit someone bought for the presses has one. Each is competent inside its own boundary. None of them was designed to be reconciled with the others.
So a plant manager who wants to know Tuesday's OEE has three numbers available and they do not match.
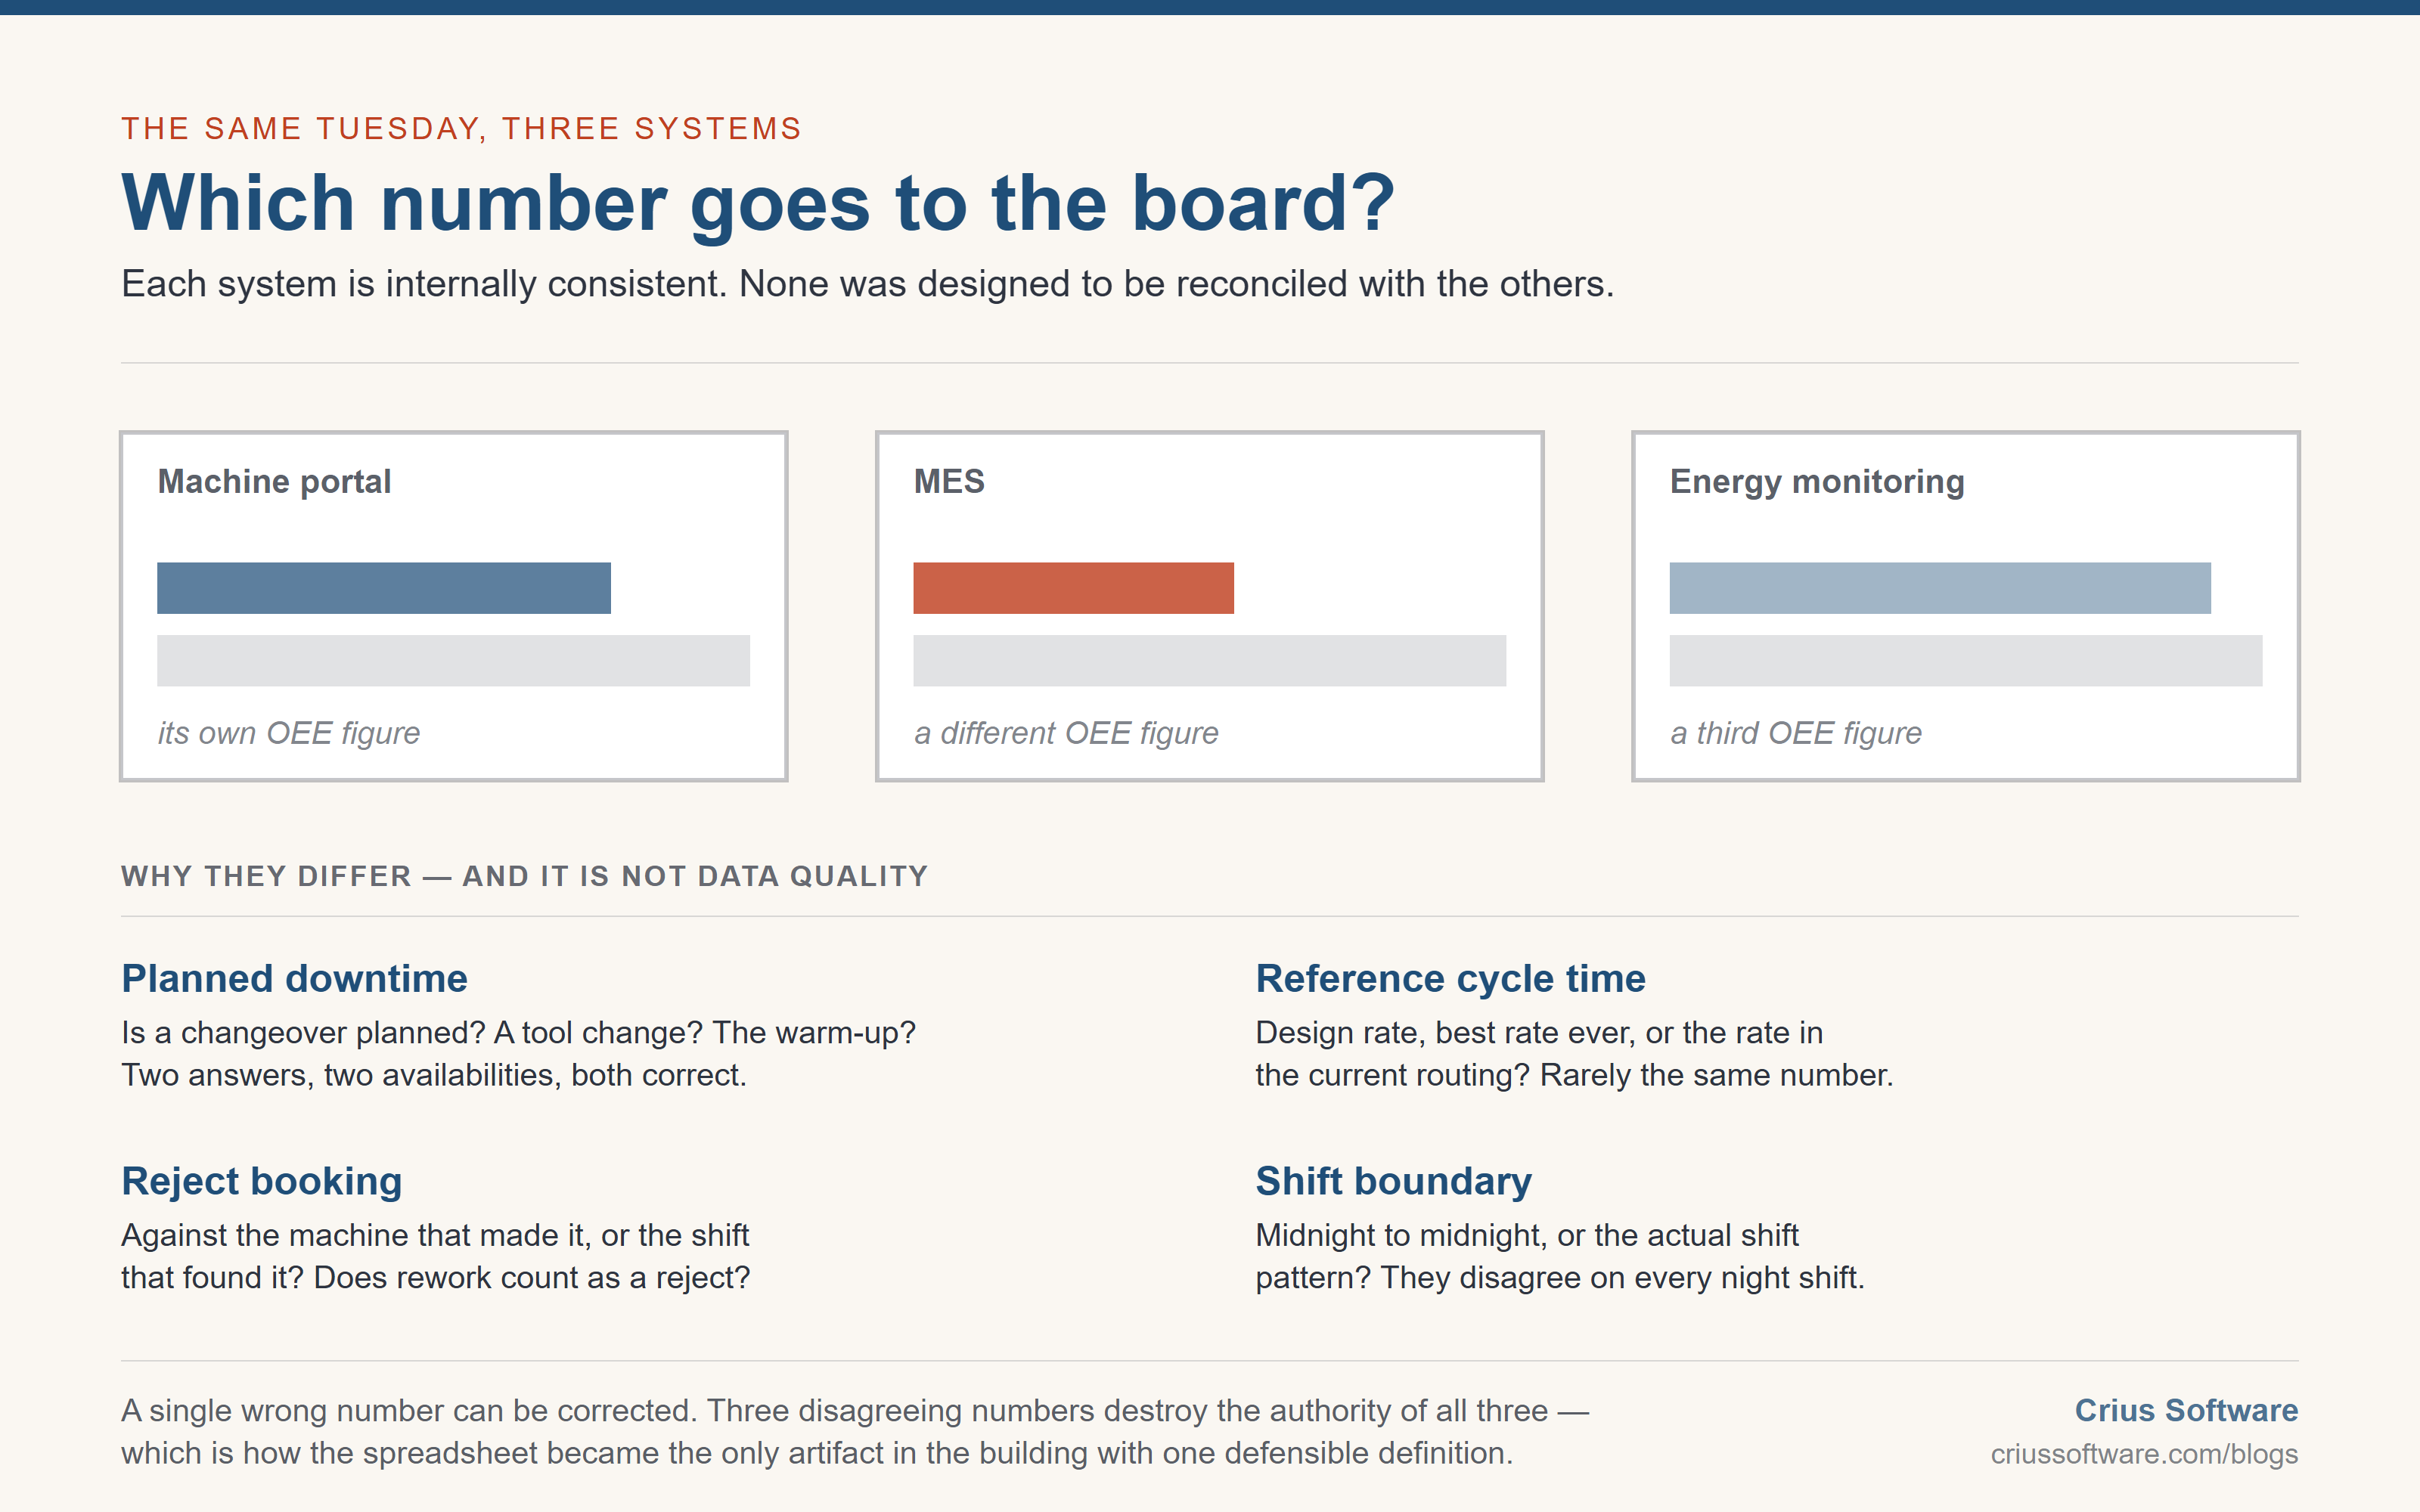
The instinct is to treat this as a data quality problem. It is not. It is a definitional problem, and it is worth understanding exactly where the divergence comes from, because it is the same everywhere:
- Availability depends entirely on what counts as planned downtime. Is a changeover planned? Is a tool change? Is the fifteen minutes of warm-up? Two systems making different choices produce different availability from identical machine behaviour, and both are correct by their own definition.
- Performance depends on the reference cycle time. Is it the design rate, the best rate ever achieved, or the rate in the current routing? One vendor's portal uses the figure in the machine's own parameters. The MES uses the figure in the work plan. These are rarely the same number and nobody ever reconciled them, because until both were displayed nobody had to.
- Quality depends on where the reject is recorded, and whether rework counts as a reject. A part scrapped at final inspection may be attributed to the machine that made it or to the shift it was found in, depending on which system is asked.
- Shift boundaries turn out to matter more than anyone expects. A system that aggregates midnight-to-midnight and a system that aggregates against the actual shift pattern will disagree on every day that contains a night shift.
None of these is a bug. Each system is internally consistent. The disagreement emerges the moment a human tries to hold two of them in mind at once.
And here is why this is worse than one screen that is simply wrong: a single wrong number can be corrected, but three disagreeing numbers destroy the authority of all three. Once a plant manager has learned that the number depends on which screen you ask, the number stops functioning as a basis for decisions. It becomes something to be negotiated in a meeting. And the thing people fall back on, when the systems disagree, is the spreadsheet — because at least the spreadsheet has one definition, maintained by one person, who can explain it.
There is a predictable next move, and it is worth naming because it is expensive. Faced with three disagreeing screens, a plant commissions a fourth — a management overview that consolidates the others into one authoritative figure. This is reasonable, it is what most integrators will happily quote for, and on its own it does not work. Consolidation does not resolve a definitional dispute; it buries one. The new screen has to pick an answer for planned downtime and reference cycle time, and whichever it picks now silently contradicts two of the three source systems, which keep running and keep showing their own numbers to the people who trust them. The plant now has four figures instead of three, and the newest one has the least operational credibility because nobody on the floor can explain how it was derived. Consolidation is the right destination; it is simply not the first step. The definitions come first, and once they exist the consolidation is straightforward — which is the reverse of the order these projects are usually run in.
That is the real origin of the spreadsheet in the opening scene. It is not technological backwardness. It is a rational response to institutional disagreement. The spreadsheet is the only artifact in the building with a single, defensible definition of the truth, and it is maintained by hand because that is what it costs to have one.
The uncomfortable part: the dashboard was not a mistake
It is tempting to read all of this as an argument that the visibility project was wasted. It was not, and pretending otherwise is both wrong and a poor way to talk to someone who signed off on it.
You cannot act on what you cannot see. Instrumentation is a precondition. A plant that skipped it and went straight to talking about automated decisions would be building on nothing. The machines needed to be connected, the signals needed to be real, and that work now exists and does not need to be redone.
The error was not doing it. The error was calling it transformation and stopping — treating a precondition as an outcome, and closing the programme when the screens went live.
It also matters for how the next conversation goes internally. A request framed as "the dashboard project did not deliver" is an accusation, and it will be resisted by everyone who worked on it — usually successfully. A request framed as "the dashboard delivered the visibility it was scoped for, and here is the specific thing that was never in scope" is a different meeting. The second framing is also the accurate one, which helps. Someone who has to defend a decision will not help you extend it; someone whose decision is being built on usually will.
This distinction matters commercially. The sunk cost is not sunk in the way people fear. The connectivity layer, the sensors, the network segmentation, the integration work — all of it remains the foundation for anything that comes next. What needs revisiting is not the infrastructure. It is the definition of done.
What closing the loop actually requires
If a dashboard is the open version, what does the closed version need? Four things, and only one of them is software.
A single definition, agreed and written down. Before any system can act on OEE, the plant has to decide what OEE means — which downtime is planned, which cycle time is the reference, where a reject is booked, when a shift starts. This is a management decision, not a technical one, and it is the step most often skipped. Every plant that has three disagreeing numbers has this decision outstanding. It can be taken in a room in an afternoon, and until it is taken, no amount of integration will make the numbers agree.
A defined trigger. Not "the operator sees red", but a stated condition and a stated response: when this signal crosses this boundary for this long, this specific thing happens. Writing these down is unglamorous and it exposes disagreement immediately, which is exactly why it is valuable.
A named owner for each trigger. A loop with no owner is a notification. The question is not who receives the alert; it is who is accountable for the outcome, and what authority they have to act without escalating.
Elapsed time as the measured quantity. Not how many anomalies were detected — that measures the sensor. The number that matters is the time from signal to action, and the proportion of signals that produced any action at all. A plant that measures this honestly usually finds the second figure shocking, and it is the single most useful number in the whole exercise, because it is the one that tells you whether the investment changed anything.
Notice that three of those four are organisational. That is not a rhetorical flourish, it is the actual distribution of the work, and it is why buying another platform rarely resolves the problem on its own. A vendor can supply the mechanism. A vendor cannot supply the definition, the accountability, or the willingness to find out how long things currently take.
It is also worth saying plainly, because the market does not: the industry as a whole is much better at the seeing than the deciding. Anyone who tells you the second half is a solved product category is selling. The honest position is that the definitions and the ownership are where most of the value is stranded, and that they are recoverable without replacing anything you own.
"We will put AI on top of it"
The current answer to a disappointing dashboard is to add an assistant to it. Ask the data a question in plain language, get an explanation back. It demonstrates well and it is genuinely useful for exploration.
It does not close the loop, and it inherits every problem described above.
An assistant sitting on top of three systems that disagree about availability will answer confidently and will be wrong in exactly the way the underlying definitions are wrong — with the disagreement now hidden behind fluent prose rather than displayed as three visibly different tiles. The tiles at least made the conflict obvious. A confident paragraph does not.
More importantly, an assistant still requires a person to ask. It is a faster way to interrogate the past. The loop closes when something happens without being asked, within a boundary someone set deliberately, and that is a question about triggers, ownership and authority — not about the interface.
None of this is an argument against the technology. It is an argument about sequence. An assistant on top of agreed definitions and defined triggers is a genuine improvement to how people work. An assistant on top of an unresolved definitional dispute is a more persuasive version of the same problem, and it will be believed more readily because it sounds like an answer.
How to measure signal-to-action in a fortnight
The elapsed-time number is the one worth having, and almost nobody has it. It does not need a project. Here is a version that a supervisor can run with the systems already in place.
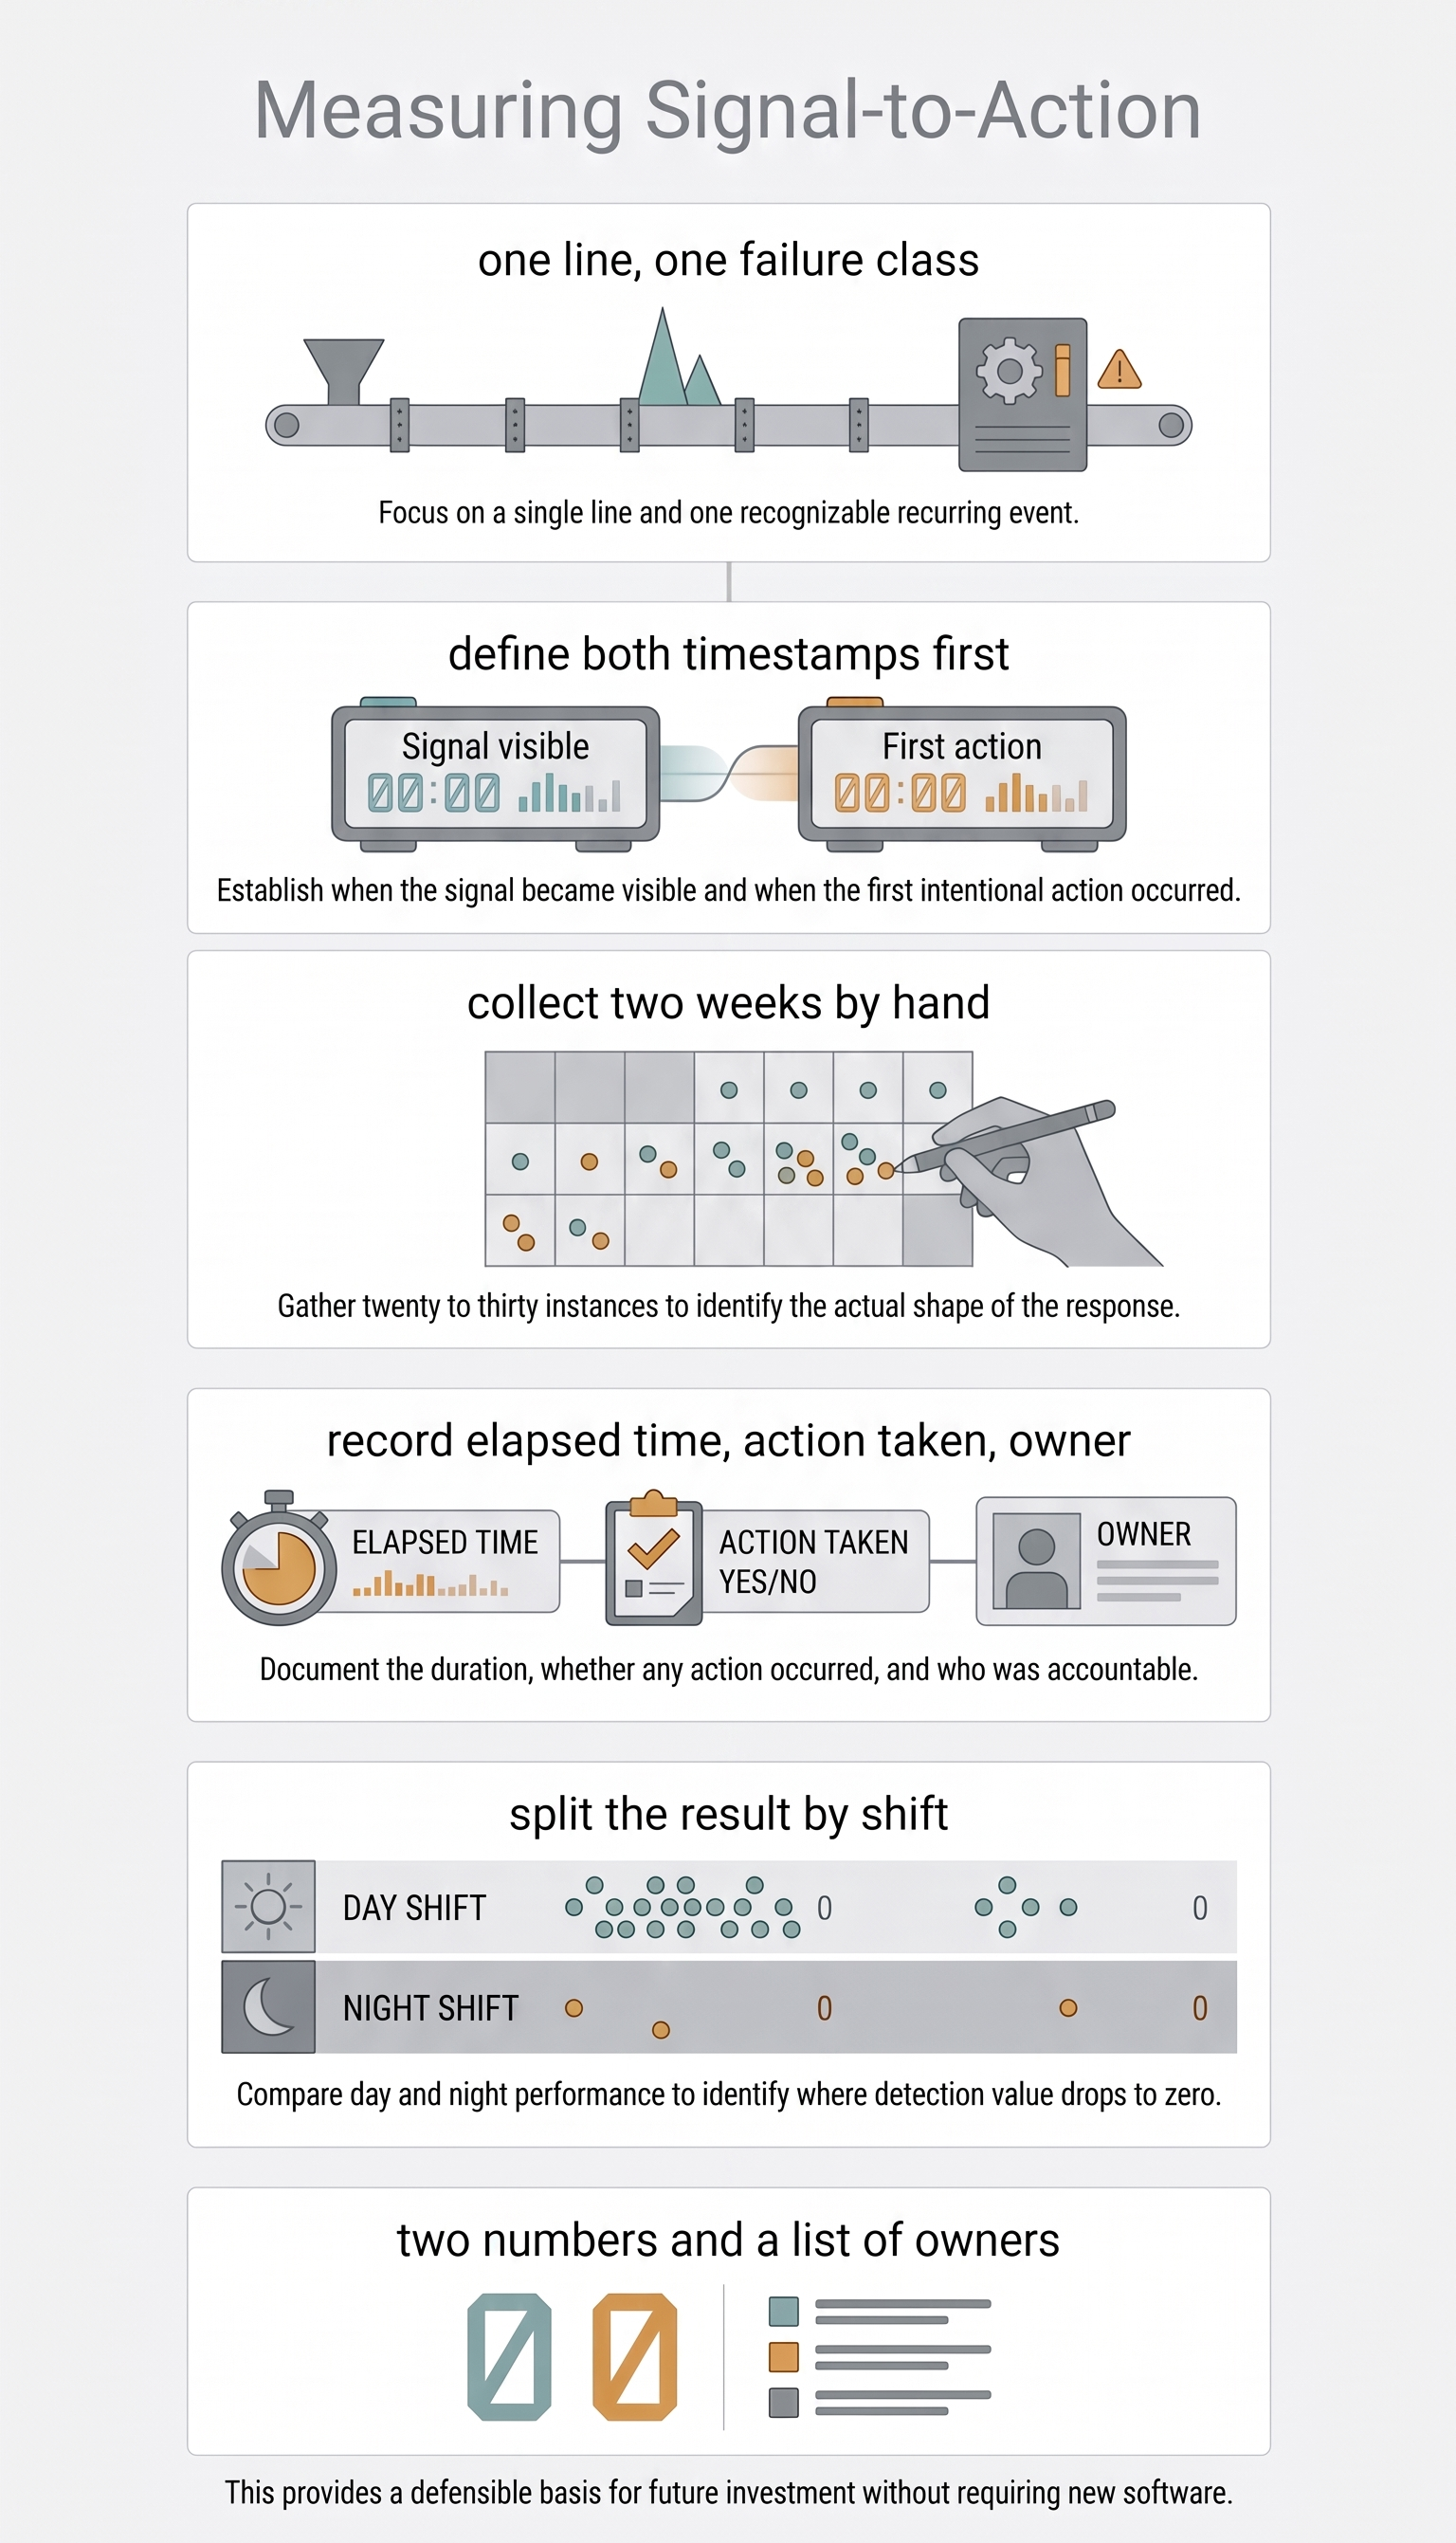
Pick one line and one failure class. Not the whole plant, and not "downtime" in general. One line, and one recurring, recognisable event — an unplanned stop over ten minutes, a specific alarm, a quality escape at a particular station. Breadth is the enemy here; you are trying to get one honest number, not a report.
Define the two timestamps before you start collecting. The signal timestamp is when the condition became visible to any system — usually available from the machine data you already log. The action timestamp is when a human did the first thing that was intended to change the outcome. Write down what counts as "the first thing", because the temptation to count the moment someone noticed is strong and it flatters the result.
Collect for two weeks, by hand, on paper if necessary. Twenty to thirty instances is enough to see the shape. You are not building a statistic; you are finding out whether the answer is twenty minutes or eleven hours, and that difference does not require precision to detect.
Record three things per instance: the elapsed time, whether any action was taken at all, and who took it. The second column is usually the revealing one. A plant that discovers that sixty per cent of its detected events produced no action whatsoever has learned something far more valuable than an average.
Then split by shift. Day-shift and night-shift elapsed times are frequently different by an order of magnitude, and the plant-wide average conceals it. If the night figure is bad, the honest reading is that the detection has no value overnight, which is a specific and fixable finding rather than a general dissatisfaction.
The output is two numbers and a list of owners. That is a stronger basis for the next investment decision than any vendor demonstration, and it costs a fortnight of someone's attention rather than a capital request. It also survives a change of supplier, because it describes your plant rather than a product.
The governance question nobody raises early enough
One more thing tends to arrive late and then arrive hard.
A dashboard that displays output by machine is an operational tool. A dashboard that displays output by named operator is something else, and in a German works-council environment it engages co-determination over technical monitoring. This is ordinary practice, not an edge case, and it is far cheaper to address at design time than after a system is live and someone has noticed a leaderboard.
The practical posture that avoids most of the difficulty: default the visible scope to site and role rather than to named individuals, make access depend on the role someone actually holds rather than on a parameter that can be set by the request, and resist the "top performer" ranking feature entirely, however harmless it looks in a demo. A system that cannot rank named people does not have to defend the ranking.
This is a design observation about industrial monitoring generally, not a legal opinion. What the law requires in a specific plant, with a specific agreement in place, is a question for people qualified to answer it — and the earlier they are in the room, the less it costs.
Six questions to ask before buying another screen
These are worth taking into the next vendor conversation, or the next internal review, more or less verbatim.
- When our system shows an anomaly, what happens next — and who does it?
- How many screens does someone reconcile before a decision gets made?
- Which decisions has the system taken in the last month without a person initiating them?
- If every dashboard went dark tomorrow, what would actually stop?
- Do our OEE numbers agree across systems — and if not, which one goes to the board?
- What is the elapsed time from signal to action, and who owns that number?
Question five is the one that tends to change the room. Question six is the one worth measuring before anything else is bought.
The arithmetic
Downtime in discrete manufacturing is commonly costed somewhere in the range of five to twenty thousand euros per hour, depending on the line, the margin and whether the order can be recovered. Scrap runs at a few per cent to low double digits. Those ranges are wide because plants are different, and any vendor quoting a precise figure for your plant without measuring it is guessing.
But the ranges are not the point. The point is the multiplier in front of them.
If the elapsed time from signal to action in your plant is four hours, and the dashboard changed it to three hours and fifty minutes, the return on the visibility investment is ten minutes multiplied by however often it happens. If the dashboard changed it to twenty minutes, the return is entirely different — and the difference between those two outcomes has almost nothing to do with the quality of the dashboard and almost everything to do with whether anyone defined a trigger, named an owner, and agreed what the number means.
That calculation is available to you now. It does not require a proof of concept, a platform decision or a vendor in the room. It requires knowing your current elapsed time, which most plants have never measured, and which is measurable in a fortnight with the data already on the screens you have.
Start there. If the number is good, the visibility investment worked and this article does not apply to you. If the number is bad, you now know something specific and actionable, and you know it before spending anything further.
Related reading on this blog: For the architectural view of why data-rich plants stay decision-poor, see Why Smart Factories Are Not Smart Yet. For what sits above the dashboard layer once the definitions are settled, see Beyond the Dashboard. For the connectivity groundwork itself, see Your Oldest Machine Is the Easy One.
Read next
- Why Smart Factories Are Not Smart Yet — the architectural view of why data-rich plants stay decision-poor.
- Beyond the Dashboard — what sits above the dashboard layer once the definitions are settled.
- Your Oldest Machine Is the Easy One — the connectivity groundwork itself.
Full blog text — board-ready report format
The Morning Meeting Still Runs on a Spreadsheet: Why Your Dashboard Did Not Change Anything
Executive summary. Most plants that describe themselves as digitalised bought visibility and called it transformation. The screens work, the data is accurate, the vendor delivered what was specified — and the morning meeting still runs on a spreadsheet. This article names the failure mode as instrumentation mistaken for intelligence, and carries three structural claims: visibility was the cheap half, a dashboard moves the work rather than removing it, and dashboards multiply and then disagree for definitional rather than technical reasons. It covers why a consolidating fourth screen buries the dispute instead of resolving it, why an AI assistant on top inherits every problem beneath it, the four things closing a loop actually requires (three of them organisational), the co-determination question that arrives late and hard, and a fortnight-long method for measuring signal-to-action time with the systems already in place.
There is a particular silence in a production meeting that happens about four minutes in.
The plant manager has the overview screen on the wall. Availability, performance, quality, a trend line, a set of coloured tiles. Someone asks why Tuesday afternoon fell over. The screen shows that Tuesday afternoon fell over. It does not show why, and it does not show what anyone did about it. So a supervisor opens a laptop, and on the laptop is a spreadsheet, and in the spreadsheet is the answer — typed in by hand, the previous evening, by someone who stayed late.
That plant is digitalised. It has the screens to prove it. It also has a spreadsheet at the centre of its decision-making, and nobody in the room finds this strange any more.
This is the most common outcome of an industrial digitalisation project, and it is not a failure of execution. The screens work. The data is accurate. The vendor delivered what was specified. The problem is that what was specified was visibility, and what was needed was a decision.
Instrumentation is not intelligence
Here is the sentence worth taking away, because it is the diagnostic: if your system needs a person to interpret every anomaly before anything happens, it is not intelligent. It is expensive monitoring.
A dashboard is a reporting artifact. It tells you what happened. It does not decide, it does not act, and it does not close a loop. Those are different capabilities with different costs, and the industry has spent a decade selling the first as though it were all three.
This matters because of what gets budgeted. A plant approves a project called OEE visibility, gets OEE visibility, and then discovers that the gap between seeing a number and changing the number was never in scope. There is no line item for it. There is no owner for it. There is, eventually, a spreadsheet for it.
Three structural claims carry the rest of this article. None of them is about technology being immature. All of them are about a category error in what was bought.
Claim one: visibility was the cheap half
Getting a signal from a machine onto a screen is, in 2026, a solved problem. That was not true fifteen years ago and it is worth being precise about why it changed. A modern control that speaks a standard information model over OPC UA — umati being the one the German machine tool sector has actually converged on — exposes its state in a form that does not need reverse engineering. Older controls give up register access over Modbus TCP. Machining centres frequently speak MTConnect. Below that there are potential-free contacts, a stack light, a signal you can read with a clamp. And below that there are machines that emit nothing at all and need a sensor added.
Every one of those bands is a known engineering problem with a known cost. There are integrators in every industrial region who do this work competently. The hard part of connectivity is commercial and organisational — warranty terms, network segmentation obligations, who is allowed to touch a control during a production week — not technical.
So when a plant celebrates having connected sixty machines, it has completed the part of the journey that money reliably buys. The tiles light up. The trend lines populate. It feels like the hard part because it took eighteen months, and it took eighteen months for reasons that had almost nothing to do with the difficulty of reading a register.
The part that money does not reliably buy comes next: deciding what to do about what the tiles say, automatically and repeatably, without a person in the middle of every instance. That second half has no natural completion ceremony. Nobody holds a go-live for it. It tends not to get a budget of its own, because the first project was called digitalisation and it is finished.
Claim two: a dashboard moves the work, it does not remove it
Before the dashboard, a problem on line three was discovered when someone noticed it. After the dashboard, a problem on line three is displayed. Someone still has to look, interpret, judge whether it matters, decide what to do, and then do it. The plant has not removed a decision. It has added a monitoring task — and it has usually added that task to a person who already had a job.
This is the quiet arithmetic that goes unexamined. A screen that surfaces forty anomalies a shift, of which three matter, has created a triage burden. If nobody is given the time to triage, one of two things happens. Either the screen is watched during the day shift and ignored at night, or it stops being watched at all and becomes wall furniture — present, expensive, and consulted only after something has already gone wrong, to confirm that it went wrong. Both outcomes are extremely common and neither shows up in any project review, because the project was delivered.
Ask the question directly and the answer is usually uncomfortable: when the dashboard shows an anomaly at 03:00 on a Sunday, what happens next, and who does it? In most plants the honest answer is nothing, until Monday. Which means the value of detecting it on Sunday was zero. The detection was real. The outcome was not.
There is a version of this that is worse. A plant that has invested in visibility often develops a reporting culture around it — a morning review of yesterday's tiles, a weekly deck, a monthly trend. The screens generate meetings. Meetings feel like management. And the underlying loop — signal, decision, action, verification — is still being closed by hand, by the same people, at the same speed as before, with better graphics.
Claim three: dashboards multiply, and then they disagree
This is the failure mode that does the most damage, and it is structural rather than accidental. Every system ships its own dashboard. The machine tool vendor's portal has one. The energy monitoring system has one. The MES has one. The retrofit sensor kit someone bought for the presses has one. Each is competent inside its own boundary. None of them was designed to be reconciled with the others. So a plant manager who wants to know Tuesday's OEE has three numbers available and they do not match.
The instinct is to treat this as a data quality problem. It is not. It is a definitional problem, and the divergence is the same everywhere. Availability depends entirely on what counts as planned downtime: is a changeover planned, is a tool change, is the fifteen minutes of warm-up? Two systems making different choices produce different availability from identical machine behaviour, and both are correct by their own definition. Performance depends on the reference cycle time — the design rate, the best rate ever achieved, or the rate in the current routing. One vendor's portal uses the figure in the machine's own parameters; the MES uses the figure in the work plan. These are rarely the same number and nobody ever reconciled them, because until both were displayed nobody had to. Quality depends on where the reject is recorded, and whether rework counts as a reject: a part scrapped at final inspection may be attributed to the machine that made it or to the shift it was found in, depending on which system is asked. Shift boundaries turn out to matter more than anyone expects — a system that aggregates midnight-to-midnight and a system that aggregates against the actual shift pattern will disagree on every day that contains a night shift.
None of these is a bug. Each system is internally consistent. The disagreement emerges the moment a human tries to hold two of them in mind at once. And here is why this is worse than one screen that is simply wrong: a single wrong number can be corrected, but three disagreeing numbers destroy the authority of all three. Once a plant manager has learned that the number depends on which screen you ask, the number stops functioning as a basis for decisions. It becomes something to be negotiated in a meeting. And the thing people fall back on, when the systems disagree, is the spreadsheet — because at least the spreadsheet has one definition, maintained by one person, who can explain it.
There is a predictable next move, and it is worth naming because it is expensive. Faced with three disagreeing screens, a plant commissions a fourth — a management overview that consolidates the others into one authoritative figure. This is reasonable, it is what most integrators will happily quote for, and on its own it does not work. Consolidation does not resolve a definitional dispute; it buries one. The new screen has to pick an answer for planned downtime and reference cycle time, and whichever it picks now silently contradicts two of the three source systems, which keep running and keep showing their own numbers to the people who trust them. The plant now has four figures instead of three, and the newest one has the least operational credibility because nobody on the floor can explain how it was derived. Consolidation is the right destination; it is simply not the first step. The definitions come first, and once they exist the consolidation is straightforward — which is the reverse of the order these projects are usually run in.
That is the real origin of the spreadsheet in the opening scene. It is not technological backwardness. It is a rational response to institutional disagreement. The spreadsheet is the only artifact in the building with a single, defensible definition of the truth, and it is maintained by hand because that is what it costs to have one.
The uncomfortable part: the dashboard was not a mistake
It is tempting to read all of this as an argument that the visibility project was wasted. It was not, and pretending otherwise is both wrong and a poor way to talk to someone who signed off on it. You cannot act on what you cannot see. Instrumentation is a precondition. A plant that skipped it and went straight to talking about automated decisions would be building on nothing. The machines needed to be connected, the signals needed to be real, and that work now exists and does not need to be redone.
The error was not doing it. The error was calling it transformation and stopping — treating a precondition as an outcome, and closing the programme when the screens went live.
It also matters for how the next conversation goes internally. A request framed as the dashboard project did not deliver is an accusation, and it will be resisted by everyone who worked on it — usually successfully. A request framed as the dashboard delivered the visibility it was scoped for, and here is the specific thing that was never in scope, is a different meeting. The second framing is also the accurate one, which helps. Someone who has to defend a decision will not help you extend it; someone whose decision is being built on usually will.
This distinction matters commercially. The sunk cost is not sunk in the way people fear. The connectivity layer, the sensors, the network segmentation, the integration work — all of it remains the foundation for anything that comes next. What needs revisiting is not the infrastructure. It is the definition of done.
What closing the loop actually requires
If a dashboard is the open version, what does the closed version need? Four things, and only one of them is software.
A single definition, agreed and written down. Before any system can act on OEE, the plant has to decide what OEE means — which downtime is planned, which cycle time is the reference, where a reject is booked, when a shift starts. This is a management decision, not a technical one, and it is the step most often skipped. Every plant that has three disagreeing numbers has this decision outstanding. It can be taken in a room in an afternoon, and until it is taken, no amount of integration will make the numbers agree.
A defined trigger. Not the operator sees red, but a stated condition and a stated response: when this signal crosses this boundary for this long, this specific thing happens. Writing these down is unglamorous and it exposes disagreement immediately, which is exactly why it is valuable.
A named owner for each trigger. A loop with no owner is a notification. The question is not who receives the alert; it is who is accountable for the outcome, and what authority they have to act without escalating.
Elapsed time as the measured quantity. Not how many anomalies were detected — that measures the sensor. The number that matters is the time from signal to action, and the proportion of signals that produced any action at all. A plant that measures this honestly usually finds the second figure shocking, and it is the single most useful number in the whole exercise, because it is the one that tells you whether the investment changed anything.
Notice that three of those four are organisational. That is not a rhetorical flourish, it is the actual distribution of the work, and it is why buying another platform rarely resolves the problem on its own. A vendor can supply the mechanism. A vendor cannot supply the definition, the accountability, or the willingness to find out how long things currently take. It is also worth saying plainly, because the market does not: the industry as a whole is much better at the seeing than the deciding. Anyone who tells you the second half is a solved product category is selling. The honest position is that the definitions and the ownership are where most of the value is stranded, and that they are recoverable without replacing anything you own.
We will put AI on top of it
The current answer to a disappointing dashboard is to add an assistant to it. Ask the data a question in plain language, get an explanation back. It demonstrates well and it is genuinely useful for exploration. It does not close the loop, and it inherits every problem described above.
An assistant sitting on top of three systems that disagree about availability will answer confidently and will be wrong in exactly the way the underlying definitions are wrong — with the disagreement now hidden behind fluent prose rather than displayed as three visibly different tiles. The tiles at least made the conflict obvious. A confident paragraph does not.
More importantly, an assistant still requires a person to ask. It is a faster way to interrogate the past. The loop closes when something happens without being asked, within a boundary someone set deliberately, and that is a question about triggers, ownership and authority — not about the interface.
None of this is an argument against the technology. It is an argument about sequence. An assistant on top of agreed definitions and defined triggers is a genuine improvement to how people work. An assistant on top of an unresolved definitional dispute is a more persuasive version of the same problem, and it will be believed more readily because it sounds like an answer.
How to measure signal-to-action in a fortnight
The elapsed-time number is the one worth having, and almost nobody has it. It does not need a project. Here is a version that a supervisor can run with the systems already in place.
Pick one line and one failure class. Not the whole plant, and not downtime in general. One line, and one recurring, recognisable event — an unplanned stop over ten minutes, a specific alarm, a quality escape at a particular station. Breadth is the enemy here; you are trying to get one honest number, not a report.
Define the two timestamps before you start collecting. The signal timestamp is when the condition became visible to any system — usually available from the machine data you already log. The action timestamp is when a human did the first thing that was intended to change the outcome. Write down what counts as the first thing, because the temptation to count the moment someone noticed is strong and it flatters the result.
Collect for two weeks, by hand, on paper if necessary. Twenty to thirty instances is enough to see the shape. You are not building a statistic; you are finding out whether the answer is twenty minutes or eleven hours, and that difference does not require precision to detect.
Record three things per instance: the elapsed time, whether any action was taken at all, and who took it. The second column is usually the revealing one. A plant that discovers that sixty per cent of its detected events produced no action whatsoever has learned something far more valuable than an average.
Then split by shift. Day-shift and night-shift elapsed times are frequently different by an order of magnitude, and the plant-wide average conceals it. If the night figure is bad, the honest reading is that the detection has no value overnight, which is a specific and fixable finding rather than a general dissatisfaction.
The output is two numbers and a list of owners. That is a stronger basis for the next investment decision than any vendor demonstration, and it costs a fortnight of someone's attention rather than a capital request. It also survives a change of supplier, because it describes your plant rather than a product.
The governance question nobody raises early enough
One more thing tends to arrive late and then arrive hard. A dashboard that displays output by machine is an operational tool. A dashboard that displays output by named operator is something else, and in a German works-council environment it engages co-determination over technical monitoring. This is ordinary practice, not an edge case, and it is far cheaper to address at design time than after a system is live and someone has noticed a leaderboard.
The practical posture that avoids most of the difficulty: default the visible scope to site and role rather than to named individuals, make access depend on the role someone actually holds rather than on a parameter that can be set by the request, and resist the top-performer ranking feature entirely, however harmless it looks in a demo. A system that cannot rank named people does not have to defend the ranking.
This is a design observation about industrial monitoring generally, not a legal opinion. What the law requires in a specific plant, with a specific agreement in place, is a question for people qualified to answer it — and the earlier they are in the room, the less it costs.
Six questions to ask before buying another screen
These are worth taking into the next vendor conversation, or the next internal review, more or less verbatim. When our system shows an anomaly, what happens next — and who does it? How many screens does someone reconcile before a decision gets made? Which decisions has the system taken in the last month without a person initiating them? If every dashboard went dark tomorrow, what would actually stop? Do our OEE numbers agree across systems — and if not, which one goes to the board? What is the elapsed time from signal to action, and who owns that number?
Question five is the one that tends to change the room. Question six is the one worth measuring before anything else is bought.
The arithmetic
Downtime in discrete manufacturing is commonly costed somewhere in the range of five to twenty thousand euros per hour, depending on the line, the margin and whether the order can be recovered. Scrap runs at a few per cent to low double digits. Those ranges are wide because plants are different, and any vendor quoting a precise figure for your plant without measuring it is guessing. But the ranges are not the point. The point is the multiplier in front of them.
If the elapsed time from signal to action in your plant is four hours, and the dashboard changed it to three hours and fifty minutes, the return on the visibility investment is ten minutes multiplied by however often it happens. If the dashboard changed it to twenty minutes, the return is entirely different — and the difference between those two outcomes has almost nothing to do with the quality of the dashboard and almost everything to do with whether anyone defined a trigger, named an owner, and agreed what the number means.
That calculation is available to you now. It does not require a proof of concept, a platform decision or a vendor in the room. It requires knowing your current elapsed time, which most plants have never measured, and which is measurable in a fortnight with the data already on the screens you have.
Start there. If the number is good, the visibility investment worked and this article does not apply to you. If the number is bad, you now know something specific and actionable, and you know it before spending anything further.
No comments yet. Be the first to comment.