

The Number You Quote With Is a Year Old: Cost per Good Part in a Year of Tariff and Energy Shocks
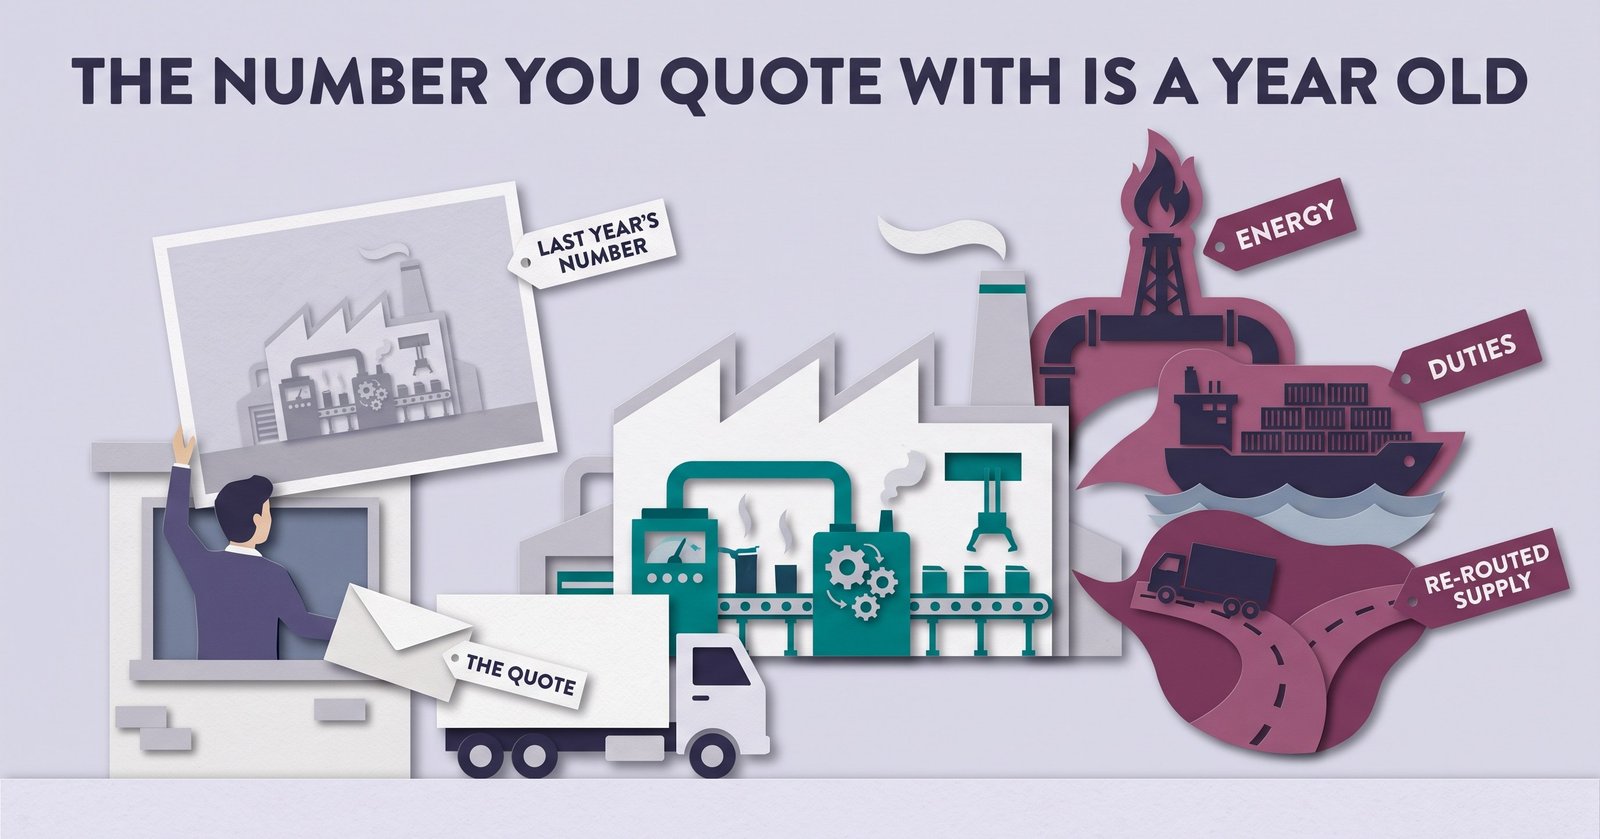
Here is the short version. In 2026 the price of what goes into a factory changed several times: metals duties, energy, the cost of finding a new supplier when the old route closed. The cost per part that most plants quote with was calculated once, at budget time, before any of that happened.
You cannot negotiate the tariff or the gas price. You can know what a part actually costs you to make, and that is the only number you bring to the table that the buyer cannot already see. This article argues for one KPI, cost per good part at actual utilisation, and shows why it is worth more this year than any dashboard.
Listen — audio overview
Industrial Reality Check
A contract manufacturer machines housings for a customer abroad. The quote for next year's volume is due on Friday. The sales lead asks finance for the cost per part, and finance gives the number from the costing system, as it has every year.
That number was built last autumn. It took the expected price of aluminium bar, a machine-hour rate based on the hours the plant planned to run, a labour rate, an energy rate, and an overhead percentage. It was correct arithmetic on the assumptions of the day.
Since then, three things happened that the number has never seen.
The material changed price, and for one customer a duty now applies to the whole value of the part, not only to its metal content. Energy rose sharply in the spring and has not come back down. And the plant lost a casting supplier in the spring, so a second supplier was qualified at short notice. The new castings need an extra machining pass and come with a higher scrap rate on the first operation.
The first two changes show up in the purchasing reports. The third barely shows up anywhere. Those minutes now sit in the machine time of every part, the extra scrap sits in the scrap bin, and the costing system still divides last year's machine cost by last year's planned hours.
On Friday the quote goes out at last year's conversion cost plus a material surcharge. It looks careful. It is missing the part of the cost the plant actually controls.
Why the Problem Exists Structurally
Most manufacturers run two cost pictures, and they were never designed to meet.
The first is the financial picture. A standard cost per part, set once a year, built from planned volumes and planned utilisation, and used for inventory valuation, budgeting and quoting. It is audited, consistent and slow by design. Changing it every month would make the accounts unreadable.
The second is the operational picture. What the machines actually did: how long each part took, how many came out good, how long the changeovers ran, how often the line stopped for a minute and restarted. That picture lives in the plant, in machine data where it exists and in shift notes where it does not. It is fast, messy and rarely expressed in money.
The cost of a part is where the two pictures should meet, and in most plants they meet only at year end, as a variance. Actual conversion cost came out higher than standard; the accounts record the difference; next year's standard is adjusted. Then the cycle starts again.
In a stable year that is fine. The variance is small, and a year is short enough. In 2026 it was not fine, because the gap opened in months, not years, and the quotes went out while it was open.
Why Now
Three things happened in 2026 that make this a global problem rather than a local one.
Energy. The war in the Middle East this year interrupted the oil and gas that move through the Persian Gulf. One month into the war, the European Commissioner for Energy said EU prices had risen by about 70 percent for natural gas and 60 percent for oil, and that they would not return to pre-war levels soon even if the conflict ended. An independent economic forecaster notes that Asian manufacturing's reliance on Gulf hydrocarbons makes it particularly vulnerable to the same shortfall. A plant in Europe and a plant in Asia met the same shock from different sides.
Duties. In the United States, from 6 April 2026, Section 232 duties on steel, aluminium and copper apply to the full customs value of covered articles and their derivatives, regardless of how much metal is in them, at tiers of 50, 25 and a transitional 15 percent. A further modification followed on 8 June. For any plant that exports metal parts or metal-intensive equipment to the US, from any country, the landed cost of the same part changed overnight.
Re-routing. The intergovernmental world trade body's outlook of 8 October raised its forecast for world merchandise trade growth in 2026 to 3.9 percent, from 1.9 percent in March. The reason it gives is worth reading slowly: supply chains adapted to the shortfall in energy and fertiliser, and other suppliers stepped in. Trade did not stop. It moved. Every one of those moves was a company switching a supplier, a route or a plant, and each switch was a cost decision made with whatever cost-per-part figure the company already had.
One industry survey gives a sense of how general this is. In a 2026 survey of foodservice-equipment manufacturers by their trade association, 91 percent said tariffs had hurt their business, 78 percent had passed tariff costs on to customers, 73 percent were investigating new or local suppliers and 75 percent were exploring nearshoring or reshoring. The association called volatility "a structural business condition". That is one sector in one country, but the pattern will be familiar to anyone who has sat in a pricing meeting this year.
None of this is about whether tariffs or energy policy are right. It is about a plain fact: the inputs now move faster than the number a plant prices with.
What Cost per Good Part Actually Means
Cost per good part is not a new idea, and it is not a software feature. It is a definition, and the definition is where most of the value lies.
Per part, not per period. A monthly cost report tells you what the plant spent. It does not tell you which product spent it. Two products can share a machine and have different costs on it.
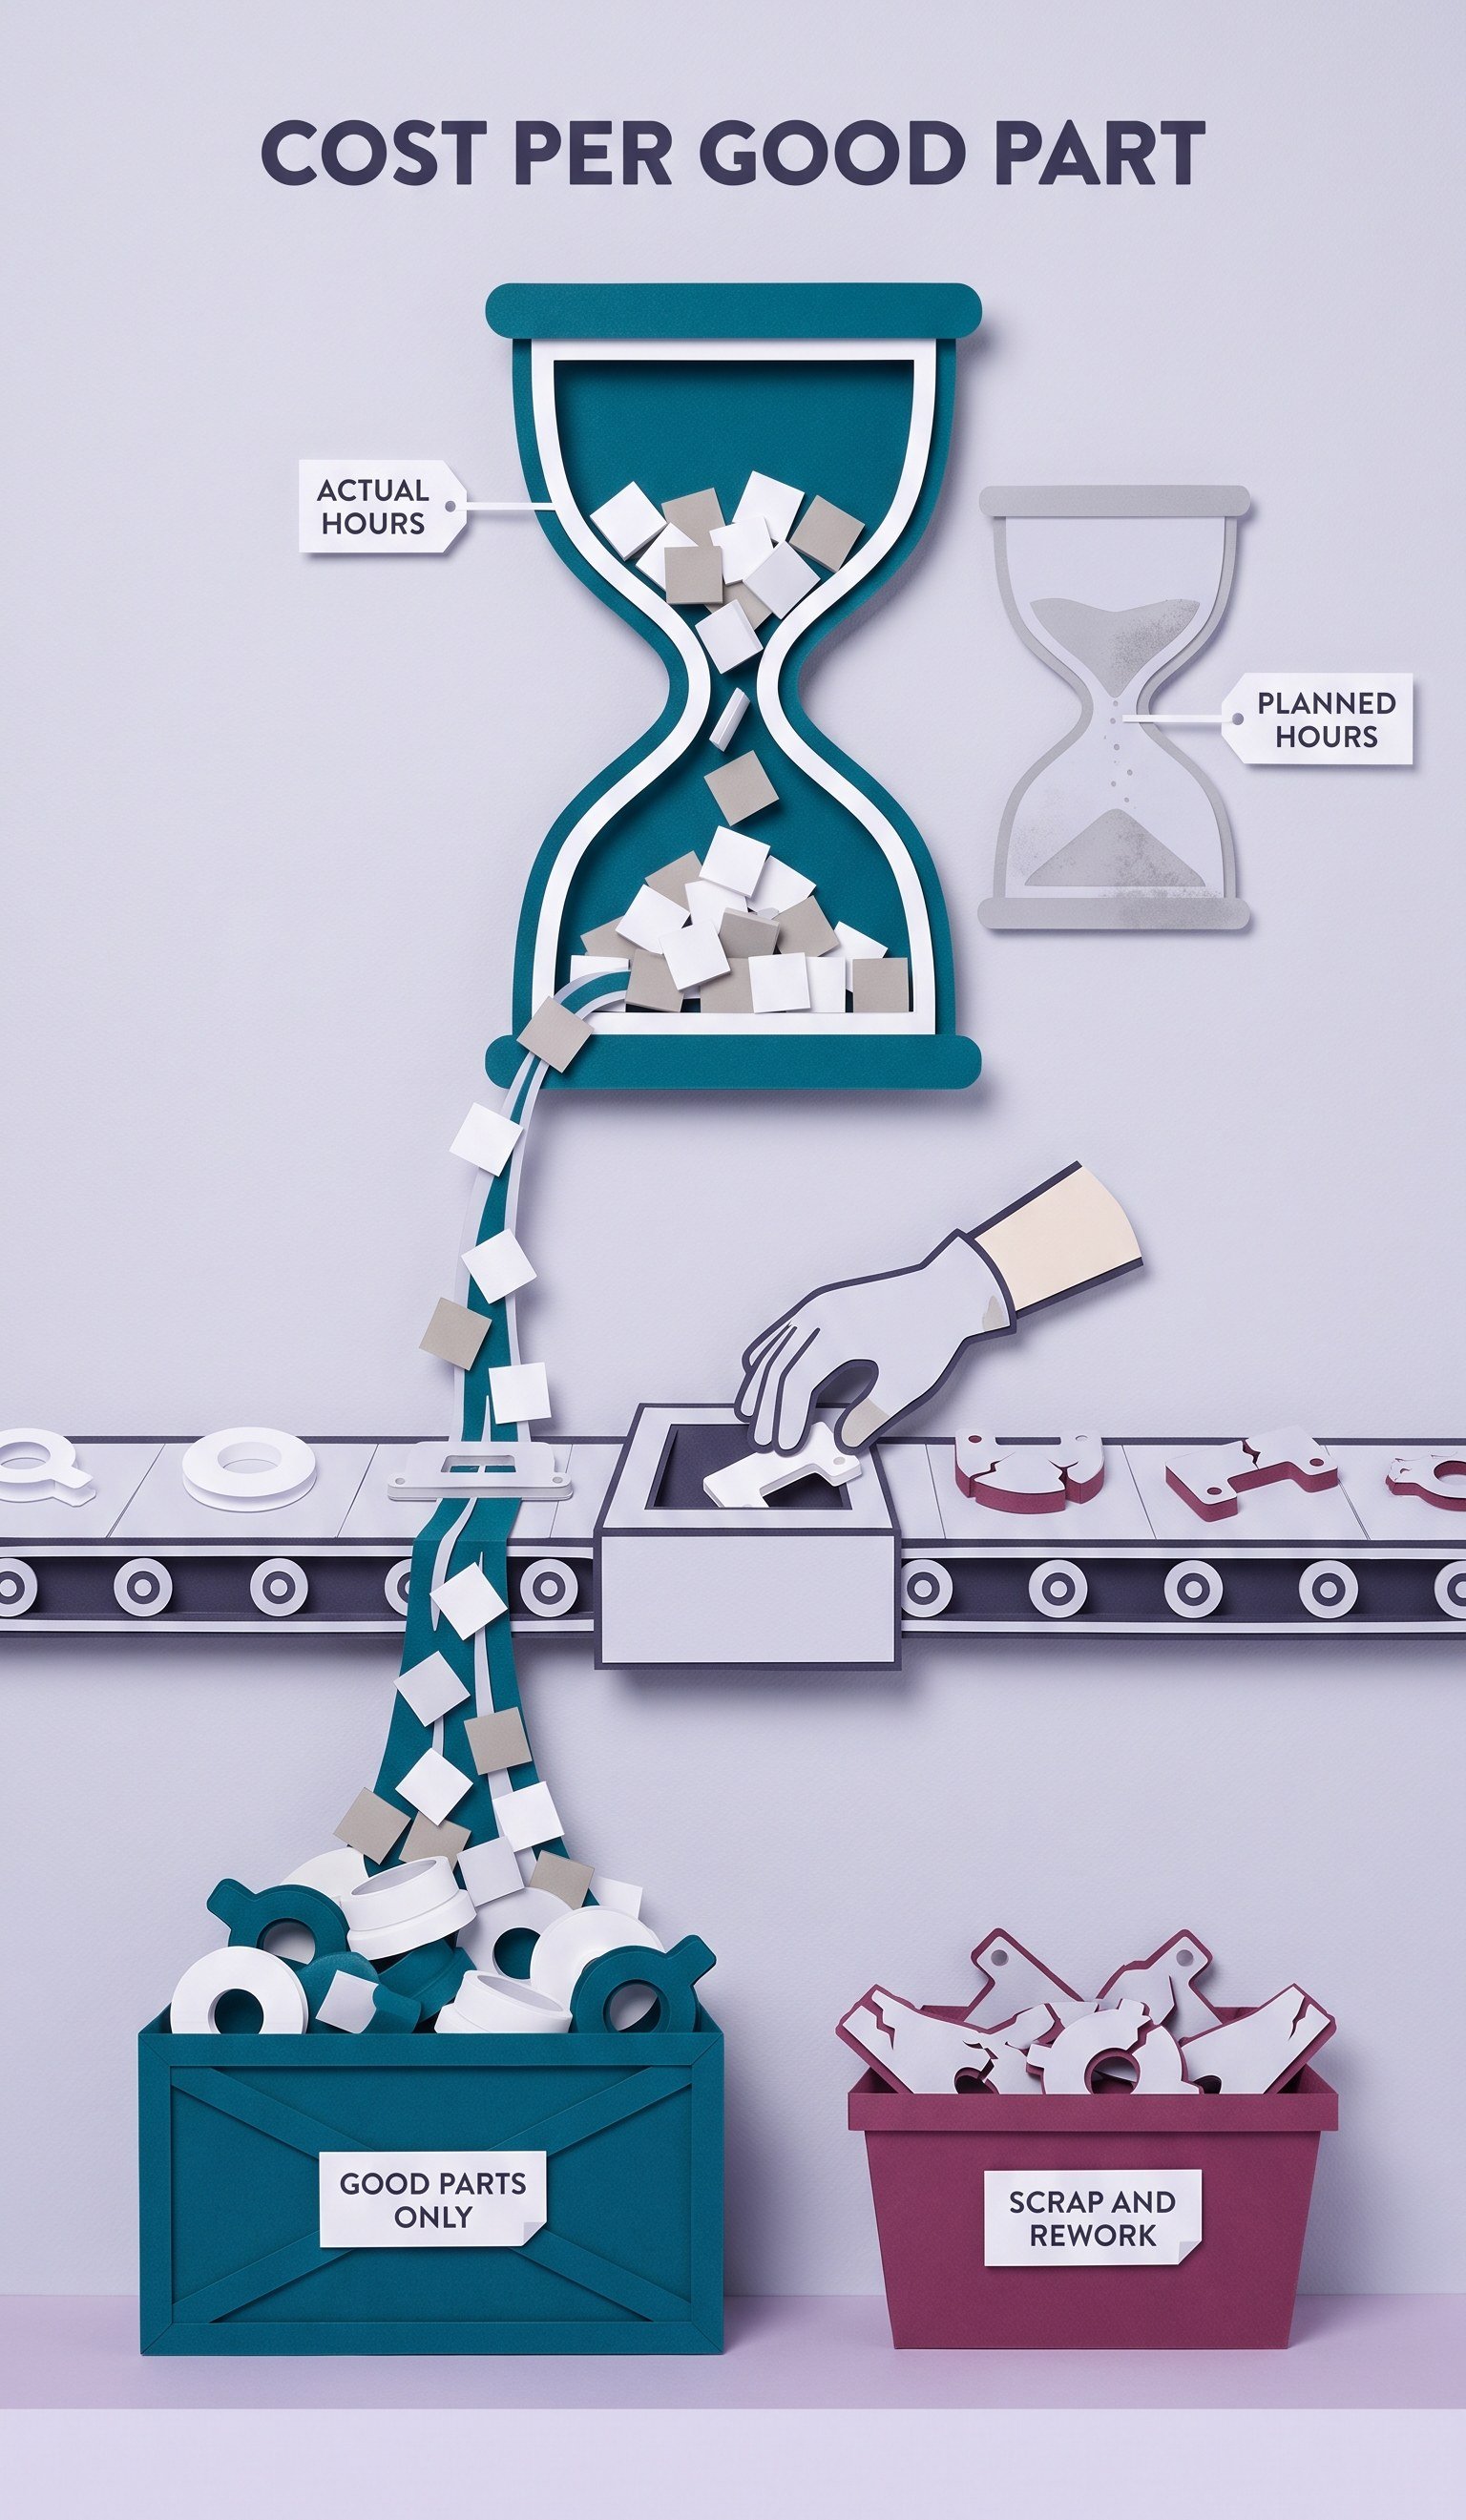
Per good part, not per part produced. If a machine makes 1,000 parts and 50 are scrapped, the cost of making 1,000 belongs to the 950 that can be sold. Dividing by 1,000 hides the scrap in the average. Dividing by 950 puts it on the product that caused it.
At actual utilisation, not planned. A machine-hour rate is the yearly cost of the machine, its space, its maintenance and its share of overhead, divided by the hours it is expected to run. If it runs fewer productive hours than planned, every productive hour carries more of that cost. The rate on paper stays the same, and the real rate rises without anyone being told.
Conversion and purchased cost kept apart. Material, bought-in components and duties are purchased cost. Machine time, labour, energy, changeover, scrap and rework are conversion cost. The buyer can already see your purchased cost. Conversion cost is the part only you can explain, and the part only you can reduce.
Put together: cost per good part is what it actually cost to convert material into one sellable part, on the machines you actually used, at the hours they actually ran, plus what you paid for the material that went into it.
An Illustrative Calculation
The numbers below are made up and round, to show the mechanism. They are not typical figures for any industry or country.
A machine costs 400,000 a year to own and run, including its share of overhead. The plant planned 4,000 productive hours, so the machine-hour rate is 100 per hour.
A part is planned at six minutes on that machine. Planned conversion cost on this machine: 10 per part.
Now the year as it happened.
- Utilisation. Short stops, waiting for material and a changeover that ran long took the machine to 3,200 productive hours. The same 400,000 over 3,200 hours is 125 per hour.
- Cycle time. The new castings need an extra pass. The part now takes six and a half minutes.
- Scrap. First-operation scrap rose to 5 percent, so only 95 parts in every 100 can be sold.
Actual conversion cost on this machine: six and a half minutes at 125 per hour is about 13.54 per part produced, and divided over good parts it is about 14.25.
The quote said 10. Nothing in the financial standard is wrong, and nothing in it shows the gap of about 42 percent. Each of the three effects is small on its own. The danger is that they compound, and that they sit in three different reports, owned by three different people.
This is also why a material surcharge alone does not protect the margin. The surcharge passes on the purchased cost the buyer can see. In this example, the conversion cost the buyer cannot see moved further than the surcharge covered.
The Named Failure Modes
These are the ways it goes wrong. Name them in your own plant and they become easier to spot.
Last year's standard. The quote goes out in October on a cost per part set the previous autumn, before the tariff, the energy price and the new supplier it never saw.
The planned-hour rate. The machine-hour rate (the Maschinenstundensatz every German controller knows) is calculated on planned utilisation. Actual utilisation drops, every part costs more than the rate says, and nothing in the system flags it.
The produced-part denominator. Cost is divided by parts produced rather than good parts, so scrap and rework disappear into an average instead of landing on the product that caused them.
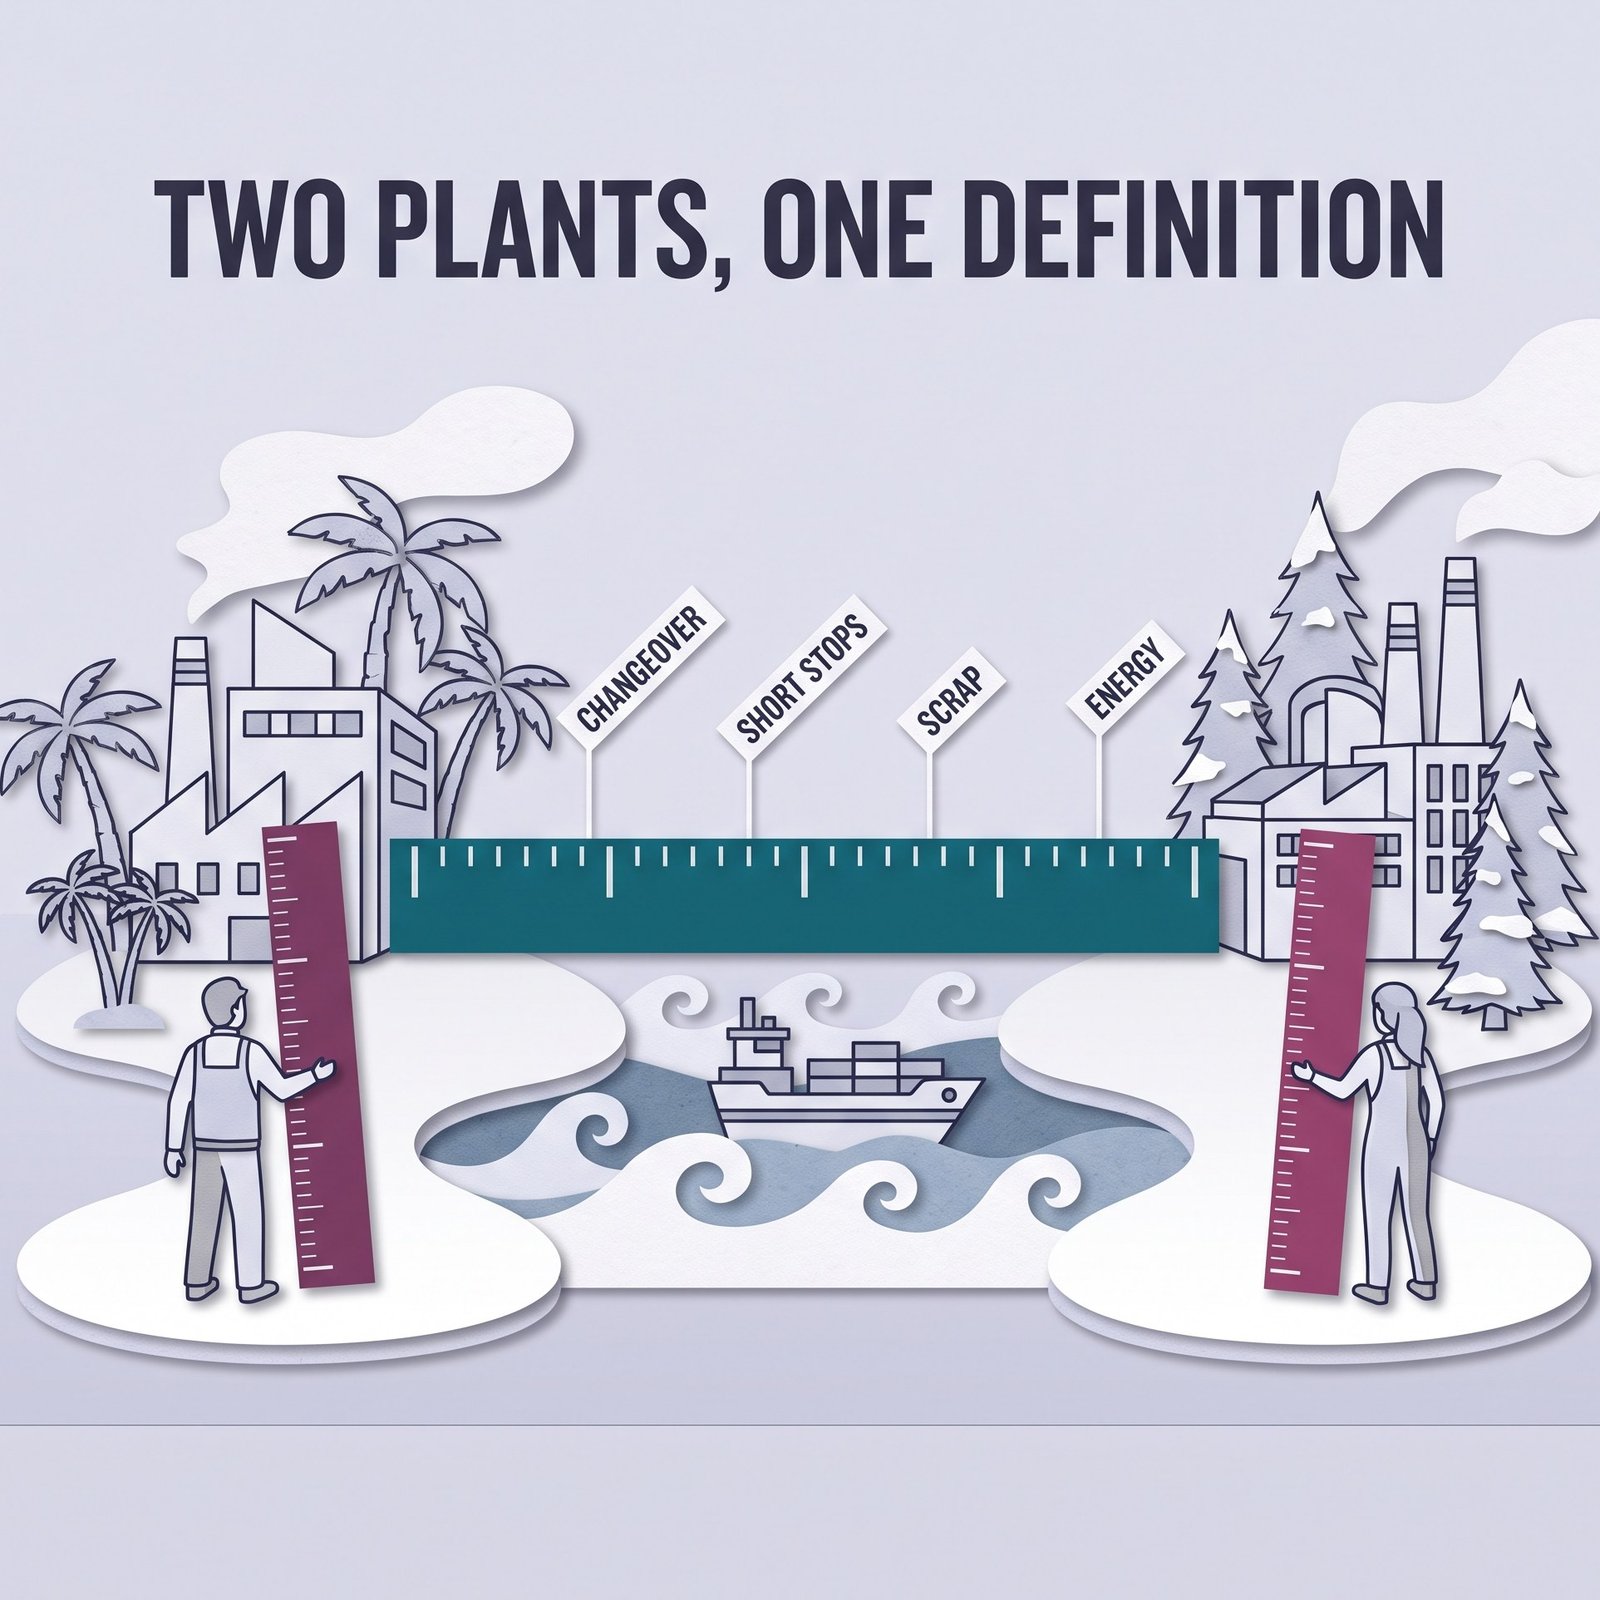
Two plants, two definitions. A company compares two of its sites, or its own site with a supplier's, on cost per part, but each site counts changeover, short stops, scrap and energy its own way. The nearshoring business case compares two definitions, not two plants.
The month-end surprise. The cost variance arrives in the accounts weeks after the price was agreed, too late for the quote and too aggregated to say which part caused it.
Why This Is a Data Problem Before It Is a Finance Problem
Finance can only calculate cost per good part from what the plant can tell it. Three of the four inputs above come from the shop floor, not from the ledger.
Productive hours per machine, cycle time per part and good parts per order are machine and quality data. In many plants they are reconstructed from shift reports, typed in at the end of a shift, or estimated. Short stops, the one- and two-minute interruptions that never get a reason code, almost never reach a report at all. We wrote about why in an earlier article, Micro-Stops: The Losses That Never Reach a Report.
Energy per part has its own trap. A site meter divided by parts produced measures your product mix, not your efficiency. We covered the four attribution decisions behind a usable energy-per-part figure in Total Site kWh Tells You Nothing.
So the order of work is the reverse of the usual one. Before anyone builds a cost-per-part dashboard, the plant needs a small number of agreed definitions and the machine data to fill them: when a machine counts as productive, what counts as a good part, how a changeover is recorded, and which energy is charged to the part. A dashboard built before those definitions exist shows a precise number for an undecided question, which is the point of Why Your Dashboard Did Not Change Anything.
What It Changes When You Have It
A cost per good part that is a few days old instead of a year old changes four conversations.
The price conversation. When a buyer asks you to absorb a cost increase, you can show which part of the price is purchased cost that moved with the market, and which part is conversion cost you have held or reduced. That is a different conversation from "costs went up".
The quote. New quotes are built on the current conversion cost of similar parts, not on last year's standard plus a surcharge, and you can see which product families no longer cover their cost.
The sourcing decision. When a supplier is replaced, the extra machining, the scrap and the inspection the new material needs are visible per part within weeks, not at year end. A cheaper casting that costs more to machine is caught while it can still be renegotiated.
The site comparison. If you run plants in more than one country, or are weighing a supplier against your own plant, a shared definition makes the comparison real. One cockpit and one definition across a mixed fleet was the argument of One Cockpit, Not Four Portals; the same logic holds across sites.
Governance: Who Owns the Number
Cost per good part sits between finance and operations, and that is exactly why it often belongs to nobody.
Finance owns the financial standard and should keep owning it. The operational figure is not a replacement for the standard cost in the accounts. It runs alongside it, as a management number, and it should be labelled that way so nobody confuses the two. We are not accountants, and nothing here suggests changing how a company values its inventory or reports its results.
Operations owns the inputs: hours, cycle times, good parts, changeovers. If those are wrong, the number is wrong, however good the formula.
Someone has to own the definitions in between. In a single plant this is often the controller working with the plant manager. In a group with plants in several countries it is a group-level decision, and it is the one most often skipped, because each plant already has a definition that works for it.
Two practical rules help. Write the definitions down on one page, with an owner and a date. And show the figure next to the standard cost rather than replacing it, so the gap between them becomes the thing people discuss.
Decision Framework: Three Questions Before You Quote Next
1. How old is the number? Find out when the cost per part on your current quotes was calculated, and list which of this year's input changes it already contains. If the answer is "the budget round", you are quoting on last year.
2. Which denominator? Check whether your machine-hour rates use planned or actual hours, and whether cost per part divides by parts produced or good parts. Each wrong denominator flatters the number in the same direction.
3. Can you split it? For your ten largest parts by revenue, try to show conversion cost separately from purchased cost. If you cannot, you cannot defend the conversion cost in a negotiation, and you cannot tell whether a surcharge covered the real increase.
Executive Summary — Board-Level Interpretation
- In 2026, input costs moved several times in months, across regions: energy after the war in the Middle East, US metals duties on full value from April, and supply re-routing that the world trade body describes as the reason trade held up.
- Most plants price on a cost per part set once a year on planned utilisation. That number did not see those changes.
- The cost the plant controls, conversion cost per good part, is usually allocated rather than measured, so it is the part of the gap nobody sees.
- A small illustrative case shows how three modest effects (lower utilisation, a longer cycle, more scrap) compound into a large gap that no single report shows.
- The fix is definitions and shop-floor data first, a dashboard second, and an operational figure that runs alongside the financial standard rather than replacing it.
- Plants that can separate conversion cost from purchased cost have a stronger position in every price, sourcing and site conversation this year.
Practical Implementation Checklist
- Pick ten parts. The ten largest by revenue, or the ten you will quote again in the next quarter.
- Date the current cost. For each, record when its standard cost was set and which inputs it assumed.
- Find actual hours. For the machines those parts run on, get last quarter's actual productive hours and compare them with the planned hours behind the rate.
- Find actual cycle time. Compare planned with actual minutes per part, including the short stops your reports do not show.
- Count good parts. Get scrap and rework per part number, not per line or per month.
- Split the cost. Separate purchased cost (material, components, duties) from conversion cost (machine, labour, energy, changeover, scrap).
- Write the definitions. One page: productive hour, good part, changeover, energy attribution. Owner and date at the top.
- Show it beside the standard. One table, both figures, the gap highlighted. Do not replace the financial standard.
- Refresh monthly, then faster. Start with a monthly figure. Move to weekly for the parts in active negotiation.
- Use it once, on purpose. Take the figure into one real quote or one supplier review and note what changed.
A note on where we stand
We make software in this space, so we are not a neutral party, and this article deliberately says nothing about what our software does. Most of the checklist above needs a spreadsheet, a controller, a plant manager and a few honest afternoons, not a product.
We have written it because the question behind a machine-data project is often a cost question that nobody has phrased that way yet.
If you would like to talk through how to define cost per good part for your own plants, or how to get the shop-floor numbers it needs, we are glad to. Leave a comment under this article and we will reply there. It is a conversation, not accounting advice.
Questions worth asking in your next review
- When was the cost per part we quoted last week calculated, and which of this year's input changes did it already include?
- Is our machine-hour rate based on planned or actual utilisation, and how far apart were the two last quarter?
- Do we divide by parts produced or by good parts, and where does the cost of scrap and rework land?
- For our ten largest parts, could we show a buyer the conversion cost separately from the purchased cost?
- If we compared two of our sites, or a supplier's site with ours, on cost per part, would both count changeover, short stops, scrap and energy the same way?
- How many weeks pass between a cost change on the shop floor and the moment we can see it per part?
The part that matters
Nobody in a plant can set the price of energy or the rate of a duty. Those numbers arrive from outside, and in 2026 they arrived often.
What a plant can do is know, with some confidence and without waiting for year end, what it costs to turn material into a part someone will pay for. That number does not make the shocks smaller. It makes them visible early enough to price, to negotiate and to choose suppliers on facts rather than on last year's assumptions.
In a stable year, a cost per part that is twelve months old is a small inaccuracy. In a year like this one, it is the biggest unmanaged number in the business.
Sources
- The intergovernmental world trade body, trade outlook and statistics, news release of 8 October 2026: merchandise trade volume forecast 3.9% for 2026 and 4.1% for 2027; supply chains adapted to disruptions in energy and fertiliser markets.
- The European Commissioner for Energy, statement one month into the war, as reported in the press: EU prices up about 70% for natural gas and 60% for oil.
- An independent economic forecasting firm, analysis of AI and energy demand pulling in opposite directions in Asia-Pacific (2026).
- A North American customs broker's trade-compliance note on US Section 232 duties on aluminium, steel and copper at full customs value: effective 6 April 2026, with a modification effective 8 June 2026.
- A trade-press report on the 2026 member survey of a North American foodservice-equipment manufacturers' association (11% response rate).
Pick one part you quote often and work out what a good one actually cost you last month. If that figure sits further from your quote than your margin does, or the shop-floor numbers to work it out are not there, say so in the comments below. We reply to every comment, and the full references behind this article are yours for the asking there too. To see first whether your machine data could give you actual hours and good-part counts, take the free self-assessment at criussoftware.com/res/kits/readiness/. It asks for a work email, your company name and your consent to be contacted, and returns a scored result.
Take the part you quoted most often this year and work out what it cost per good part last month, on the hours the machine really ran. If the answer is close to the quote, you have proof. If it is not, you have found the conversation to have before the next one.
Read next
- Micro-Stops: The Losses That Never Reach a Report — the short stops that quietly lower actual utilisation, and how to count them.
- Total Site kWh Tells You Nothing — getting from the site meter to energy per part, the energy line inside cost per good part.
- One Cockpit, Not Four Portals — one definition across a mixed fleet, the precondition for any fair site comparison.
- Why Your Dashboard Did Not Change Anything — why a new number changes nothing until someone owns it and acts on it.
Full blog text — board-ready report format
The Number You Quote With Is a Year Old: Cost per Good Part in a Year of Tariff and Energy Shocks
Here is the short version. In 2026 the price of what goes into a factory changed several times: metals duties, energy, the cost of finding a new supplier when the old route closed. The cost per part that most plants quote with was calculated once, at budget time, before any of that happened.
You cannot negotiate the tariff or the gas price. You can know what a part actually costs you to make, and that is the only number you bring to the table that the buyer cannot already see. This article argues for one KPI, cost per good part at actual utilisation, and shows why it is worth more this year than any dashboard.
Industrial Reality Check
A contract manufacturer machines housings for a customer abroad. The quote for next year's volume is due on Friday. The sales lead asks finance for the cost per part, and finance gives the number from the costing system, as it has every year.
That number was built last autumn. It took the expected price of aluminium bar, a machine-hour rate based on the hours the plant planned to run, a labour rate, an energy rate, and an overhead percentage. It was correct arithmetic on the assumptions of the day.
Since then, three things happened that the number has never seen.
The material changed price, and for one customer a duty now applies to the whole value of the part, not only to its metal content. Energy rose sharply in the spring and has not come back down. And the plant lost a casting supplier in the spring, so a second supplier was qualified at short notice. The new castings need an extra machining pass and come with a higher scrap rate on the first operation.
The first two changes show up in the purchasing reports. The third barely shows up anywhere. Those minutes now sit in the machine time of every part, the extra scrap sits in the scrap bin, and the costing system still divides last year's machine cost by last year's planned hours.
On Friday the quote goes out at last year's conversion cost plus a material surcharge. It looks careful. It is missing the part of the cost the plant actually controls.
Why the Problem Exists Structurally
Most manufacturers run two cost pictures, and they were never designed to meet.
The first is the financial picture. A standard cost per part, set once a year, built from planned volumes and planned utilisation, and used for inventory valuation, budgeting and quoting. It is audited, consistent and slow by design. Changing it every month would make the accounts unreadable.
The second is the operational picture. What the machines actually did: how long each part took, how many came out good, how long the changeovers ran, how often the line stopped for a minute and restarted. That picture lives in the plant, in machine data where it exists and in shift notes where it does not. It is fast, messy and rarely expressed in money.
The cost of a part is where the two pictures should meet, and in most plants they meet only at year end, as a variance. Actual conversion cost came out higher than standard; the accounts record the difference; next year's standard is adjusted. Then the cycle starts again.
In a stable year that is fine. The variance is small, and a year is short enough. In 2026 it was not fine, because the gap opened in months, not years, and the quotes went out while it was open.
Why Now
Three things happened in 2026 that make this a global problem rather than a local one.
Energy. The war in the Middle East this year interrupted the oil and gas that move through the Persian Gulf. One month into the war, the European Commissioner for Energy said EU prices had risen by about 70 percent for natural gas and 60 percent for oil, and that they would not return to pre-war levels soon even if the conflict ended. An independent economic forecaster notes that Asian manufacturing's reliance on Gulf hydrocarbons makes it particularly vulnerable to the same shortfall. A plant in Europe and a plant in Asia met the same shock from different sides.
Duties. In the United States, from 6 April 2026, Section 232 duties on steel, aluminium and copper apply to the full customs value of covered articles and their derivatives, regardless of how much metal is in them, at tiers of 50, 25 and a transitional 15 percent. A further modification followed on 8 June. For any plant that exports metal parts or metal-intensive equipment to the US, from any country, the landed cost of the same part changed overnight.
Re-routing. The intergovernmental world trade body's outlook of 8 October raised its forecast for world merchandise trade growth in 2026 to 3.9 percent, from 1.9 percent in March. The reason it gives is worth reading slowly: supply chains adapted to the shortfall in energy and fertiliser, and other suppliers stepped in. Trade did not stop. It moved. Every one of those moves was a company switching a supplier, a route or a plant, and each switch was a cost decision made with whatever cost-per-part figure the company already had.
One industry survey gives a sense of how general this is. In a 2026 survey of foodservice-equipment manufacturers by their trade association, 91 percent said tariffs had hurt their business, 78 percent had passed tariff costs on to customers, 73 percent were investigating new or local suppliers and 75 percent were exploring nearshoring or reshoring. The association called volatility "a structural business condition". That is one sector in one country, but the pattern will be familiar to anyone who has sat in a pricing meeting this year.
None of this is about whether tariffs or energy policy are right. It is about a plain fact: the inputs now move faster than the number a plant prices with.
What Cost per Good Part Actually Means
Cost per good part is not a new idea, and it is not a software feature. It is a definition, and the definition is where most of the value lies.
Per part, not per period. A monthly cost report tells you what the plant spent. It does not tell you which product spent it. Two products can share a machine and have different costs on it.
Per good part, not per part produced. If a machine makes 1,000 parts and 50 are scrapped, the cost of making 1,000 belongs to the 950 that can be sold. Dividing by 1,000 hides the scrap in the average. Dividing by 950 puts it on the product that caused it.
At actual utilisation, not planned. A machine-hour rate is the yearly cost of the machine, its space, its maintenance and its share of overhead, divided by the hours it is expected to run. If it runs fewer productive hours than planned, every productive hour carries more of that cost. The rate on paper stays the same, and the real rate rises without anyone being told.
Conversion and purchased cost kept apart. Material, bought-in components and duties are purchased cost. Machine time, labour, energy, changeover, scrap and rework are conversion cost. The buyer can already see your purchased cost. Conversion cost is the part only you can explain, and the part only you can reduce.
Put together: cost per good part is what it actually cost to convert material into one sellable part, on the machines you actually used, at the hours they actually ran, plus what you paid for the material that went into it.
An Illustrative Calculation
The numbers below are made up and round, to show the mechanism. They are not typical figures for any industry or country.
A machine costs 400,000 a year to own and run, including its share of overhead. The plant planned 4,000 productive hours, so the machine-hour rate is 100 per hour.
A part is planned at six minutes on that machine. Planned conversion cost on this machine: 10 per part.
Now the year as it happened.
- Utilisation. Short stops, waiting for material and a changeover that ran long took the machine to 3,200 productive hours. The same 400,000 over 3,200 hours is 125 per hour.
- Cycle time. The new castings need an extra pass. The part now takes six and a half minutes.
- Scrap. First-operation scrap rose to 5 percent, so only 95 parts in every 100 can be sold.
Actual conversion cost on this machine: six and a half minutes at 125 per hour is about 13.54 per part produced, and divided over good parts it is about 14.25.
The quote said 10. Nothing in the financial standard is wrong, and nothing in it shows the gap of about 42 percent. Each of the three effects is small on its own. The danger is that they compound, and that they sit in three different reports, owned by three different people.
This is also why a material surcharge alone does not protect the margin. The surcharge passes on the purchased cost the buyer can see. In this example, the conversion cost the buyer cannot see moved further than the surcharge covered.
The Named Failure Modes
These are the ways it goes wrong. Name them in your own plant and they become easier to spot.
Last year's standard. The quote goes out in October on a cost per part set the previous autumn, before the tariff, the energy price and the new supplier it never saw.
The planned-hour rate. The machine-hour rate (the Maschinenstundensatz every German controller knows) is calculated on planned utilisation. Actual utilisation drops, every part costs more than the rate says, and nothing in the system flags it.
The produced-part denominator. Cost is divided by parts produced rather than good parts, so scrap and rework disappear into an average instead of landing on the product that caused them.
Two plants, two definitions. A company compares two of its sites, or its own site with a supplier's, on cost per part, but each site counts changeover, short stops, scrap and energy its own way. The nearshoring business case compares two definitions, not two plants.
The month-end surprise. The cost variance arrives in the accounts weeks after the price was agreed, too late for the quote and too aggregated to say which part caused it.
Why This Is a Data Problem Before It Is a Finance Problem
Finance can only calculate cost per good part from what the plant can tell it. Three of the four inputs above come from the shop floor, not from the ledger.
Productive hours per machine, cycle time per part and good parts per order are machine and quality data. In many plants they are reconstructed from shift reports, typed in at the end of a shift, or estimated. Short stops, the one- and two-minute interruptions that never get a reason code, almost never reach a report at all. We wrote about why in an earlier article, Micro-Stops: The Losses That Never Reach a Report.
Energy per part has its own trap. A site meter divided by parts produced measures your product mix, not your efficiency. We covered the four attribution decisions behind a usable energy-per-part figure in Total Site kWh Tells You Nothing.
So the order of work is the reverse of the usual one. Before anyone builds a cost-per-part dashboard, the plant needs a small number of agreed definitions and the machine data to fill them: when a machine counts as productive, what counts as a good part, how a changeover is recorded, and which energy is charged to the part. A dashboard built before those definitions exist shows a precise number for an undecided question, which is the point of Why Your Dashboard Did Not Change Anything.
What It Changes When You Have It
A cost per good part that is a few days old instead of a year old changes four conversations.
The price conversation. When a buyer asks you to absorb a cost increase, you can show which part of the price is purchased cost that moved with the market, and which part is conversion cost you have held or reduced. That is a different conversation from "costs went up".
The quote. New quotes are built on the current conversion cost of similar parts, not on last year's standard plus a surcharge, and you can see which product families no longer cover their cost.
The sourcing decision. When a supplier is replaced, the extra machining, the scrap and the inspection the new material needs are visible per part within weeks, not at year end. A cheaper casting that costs more to machine is caught while it can still be renegotiated.
The site comparison. If you run plants in more than one country, or are weighing a supplier against your own plant, a shared definition makes the comparison real. One cockpit and one definition across a mixed fleet was the argument of One Cockpit, Not Four Portals; the same logic holds across sites.
Governance: Who Owns the Number
Cost per good part sits between finance and operations, and that is exactly why it often belongs to nobody.
Finance owns the financial standard and should keep owning it. The operational figure is not a replacement for the standard cost in the accounts. It runs alongside it, as a management number, and it should be labelled that way so nobody confuses the two. We are not accountants, and nothing here suggests changing how a company values its inventory or reports its results.
Operations owns the inputs: hours, cycle times, good parts, changeovers. If those are wrong, the number is wrong, however good the formula.
Someone has to own the definitions in between. In a single plant this is often the controller working with the plant manager. In a group with plants in several countries it is a group-level decision, and it is the one most often skipped, because each plant already has a definition that works for it.
Two practical rules help. Write the definitions down on one page, with an owner and a date. And show the figure next to the standard cost rather than replacing it, so the gap between them becomes the thing people discuss.
Decision Framework: Three Questions Before You Quote Next
1. How old is the number? Find out when the cost per part on your current quotes was calculated, and list which of this year's input changes it already contains. If the answer is "the budget round", you are quoting on last year.
2. Which denominator? Check whether your machine-hour rates use planned or actual hours, and whether cost per part divides by parts produced or good parts. Each wrong denominator flatters the number in the same direction.
3. Can you split it? For your ten largest parts by revenue, try to show conversion cost separately from purchased cost. If you cannot, you cannot defend the conversion cost in a negotiation, and you cannot tell whether a surcharge covered the real increase.
Executive Summary — Board-Level Interpretation
- In 2026, input costs moved several times in months, across regions: energy after the war in the Middle East, US metals duties on full value from April, and supply re-routing that the world trade body describes as the reason trade held up.
- Most plants price on a cost per part set once a year on planned utilisation. That number did not see those changes.
- The cost the plant controls, conversion cost per good part, is usually allocated rather than measured, so it is the part of the gap nobody sees.
- A small illustrative case shows how three modest effects (lower utilisation, a longer cycle, more scrap) compound into a large gap that no single report shows.
- The fix is definitions and shop-floor data first, a dashboard second, and an operational figure that runs alongside the financial standard rather than replacing it.
- Plants that can separate conversion cost from purchased cost have a stronger position in every price, sourcing and site conversation this year.
Practical Implementation Checklist
- Pick ten parts. The ten largest by revenue, or the ten you will quote again in the next quarter.
- Date the current cost. For each, record when its standard cost was set and which inputs it assumed.
- Find actual hours. For the machines those parts run on, get last quarter's actual productive hours and compare them with the planned hours behind the rate.
- Find actual cycle time. Compare planned with actual minutes per part, including the short stops your reports do not show.
- Count good parts. Get scrap and rework per part number, not per line or per month.
- Split the cost. Separate purchased cost (material, components, duties) from conversion cost (machine, labour, energy, changeover, scrap).
- Write the definitions. One page: productive hour, good part, changeover, energy attribution. Owner and date at the top.
- Show it beside the standard. One table, both figures, the gap highlighted. Do not replace the financial standard.
- Refresh monthly, then faster. Start with a monthly figure. Move to weekly for the parts in active negotiation.
- Use it once, on purpose. Take the figure into one real quote or one supplier review and note what changed.
A note on where we stand
We make software in this space, so we are not a neutral party, and this article deliberately says nothing about what our software does. Most of the checklist above needs a spreadsheet, a controller, a plant manager and a few honest afternoons, not a product.
We have written it because the question behind a machine-data project is often a cost question that nobody has phrased that way yet.
If you would like to talk through how to define cost per good part for your own plants, or how to get the shop-floor numbers it needs, we are glad to. Leave a comment under this article and we will reply there. It is a conversation, not accounting advice.
Questions worth asking in your next review
- When was the cost per part we quoted last week calculated, and which of this year's input changes did it already include?
- Is our machine-hour rate based on planned or actual utilisation, and how far apart were the two last quarter?
- Do we divide by parts produced or by good parts, and where does the cost of scrap and rework land?
- For our ten largest parts, could we show a buyer the conversion cost separately from the purchased cost?
- If we compared two of our sites, or a supplier's site with ours, on cost per part, would both count changeover, short stops, scrap and energy the same way?
- How many weeks pass between a cost change on the shop floor and the moment we can see it per part?
The part that matters
Nobody in a plant can set the price of energy or the rate of a duty. Those numbers arrive from outside, and in 2026 they arrived often.
What a plant can do is know, with some confidence and without waiting for year end, what it costs to turn material into a part someone will pay for. That number does not make the shocks smaller. It makes them visible early enough to price, to negotiate and to choose suppliers on facts rather than on last year's assumptions.
In a stable year, a cost per part that is twelve months old is a small inaccuracy. In a year like this one, it is the biggest unmanaged number in the business.
Sources
- The intergovernmental world trade body, trade outlook and statistics, news release of 8 October 2026: merchandise trade volume forecast 3.9% for 2026 and 4.1% for 2027; supply chains adapted to disruptions in energy and fertiliser markets.
- The European Commissioner for Energy, statement one month into the war, as reported in the press: EU prices up about 70% for natural gas and 60% for oil.
- An independent economic forecasting firm, analysis of AI and energy demand pulling in opposite directions in Asia-Pacific (2026).
- A North American customs broker's trade-compliance note on US Section 232 duties on aluminium, steel and copper at full customs value: effective 6 April 2026, with a modification effective 8 June 2026.
- A trade-press report on the 2026 member survey of a North American foodservice-equipment manufacturers' association (11% response rate).
Pick one part you quote often and work out what a good one actually cost you last month. If that figure sits further from your quote than your margin does, or the shop-floor numbers to work it out are not there, say so in the comments below. We reply to every comment, and the full references behind this article are yours for the asking there too. To see first whether your machine data could give you actual hours and good-part counts, take the free self-assessment at criussoftware.com/res/kits/readiness/. It asks for a work email, your company name and your consent to be contacted, and returns a scored result.
No comments yet. Be the first to comment.